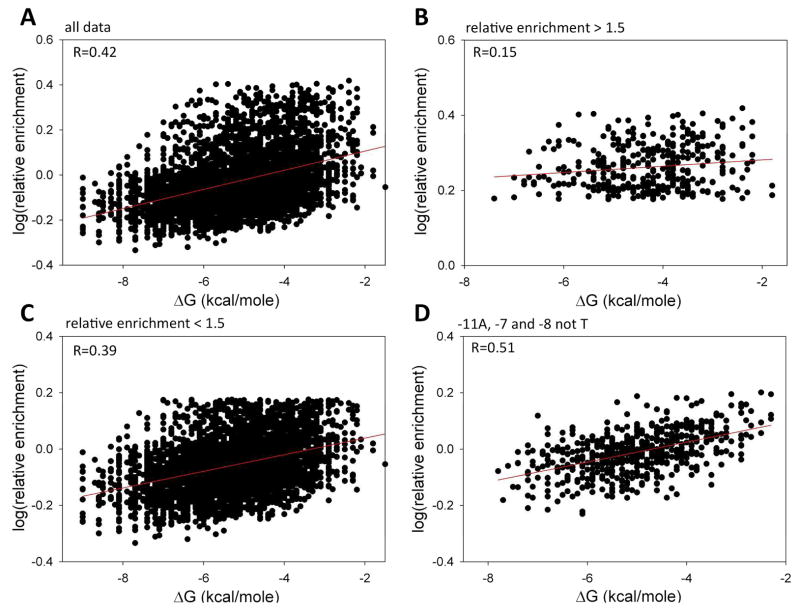
Figure 8.
(A) Correlation between relative enrichment at 6 sec time point and free energy of DNA duplex melting for all 4096 -10 element sequence variants. (B) Correlation between relative enrichment at 6 sec time point and free energy of DNA duplex melting for sequence with relative enrichment > 1.5. (C) Correlation between relative enrichment at 6 sec time point and free energy of DNA duplex melting for sequence with relative enrichment < 1.5. (D) Correlation between relative enrichment at 6 sec time point and free energy of DNA duplex melting for sequences with A at -11 and A or G or C at positions -8 and -7.

