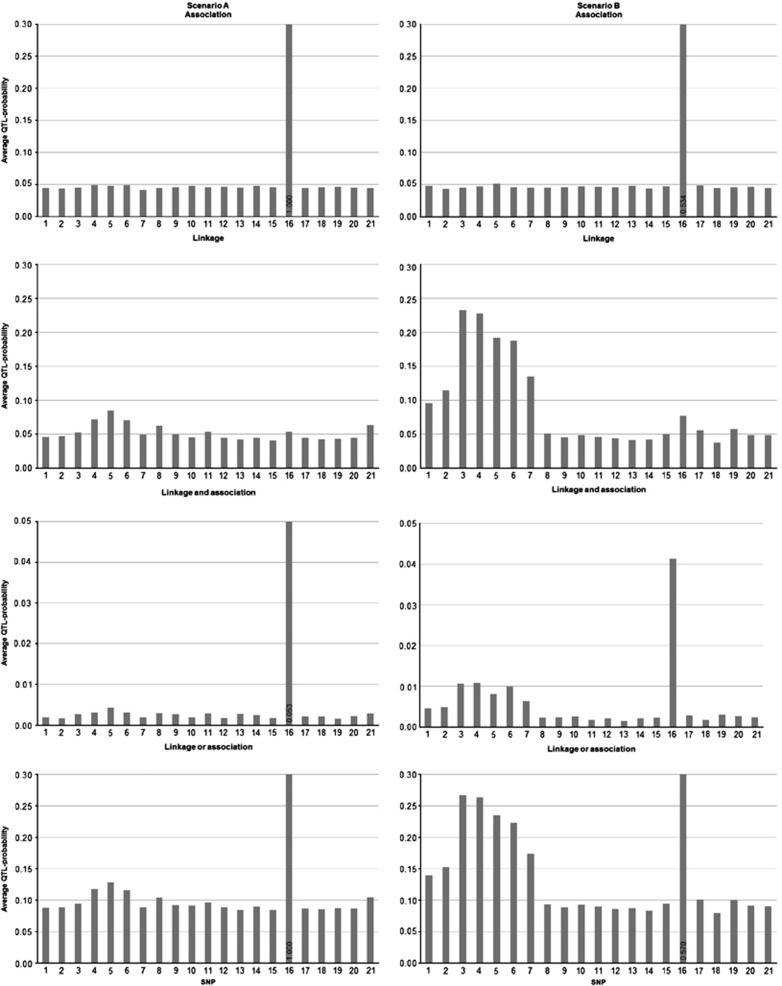
Figure 1.
Mean posterior occupancy probabilities for SNPs obtained from Bayesian LDLA analysis by averaging QTL-probability estimates over 25 replicated data sets in scenario A (left) and in scenario B (right). Index of SNPs on x-axis and average QTL probabilities on y-axis calculated from indicator variables in the MCMC sample for association (top panel), linkage (second panel), linkage and association (third panel), linkage or association (bottom panel). Note that y-axis scales in panels depend on prior occupancy probabilities. In cases where QTL probability exceeds the upper limit of the y-axis, its value is presented in the bottom of each column of the bar chart.

