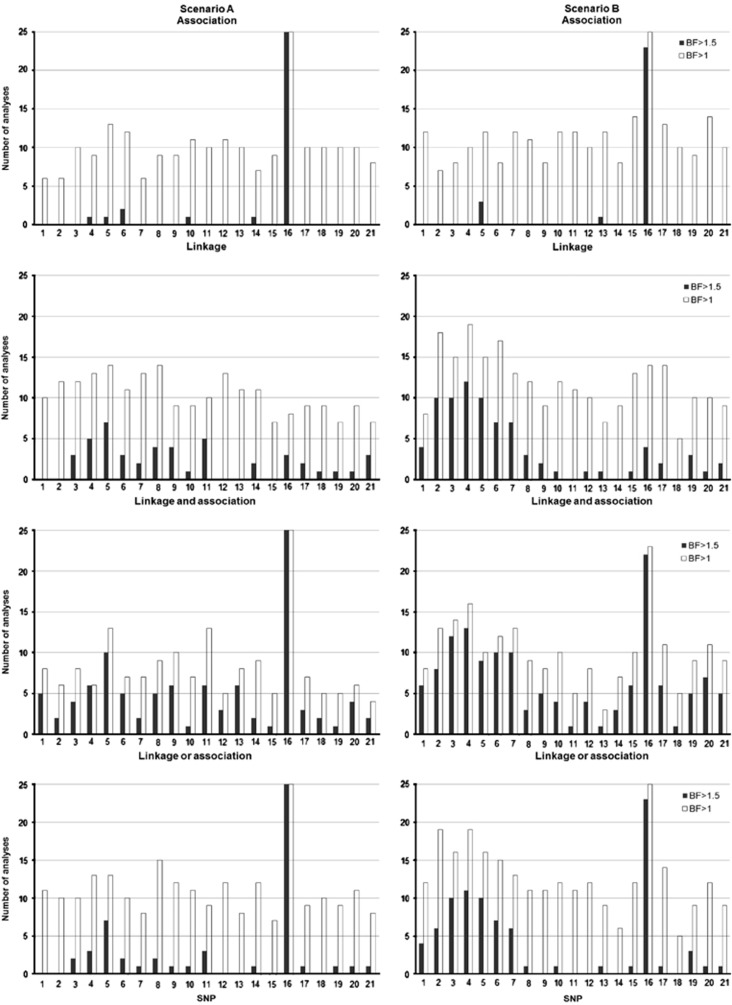
Figure 2.
Number of Bayesian LDLA analyses where BF exceeds a given threshold. Index of SNPs on the x-axis and the number of analyses where BF exceeds values 1 and 1.5 on the y-axis. Scenario A is shown on the left and scenario B on the right. The first panel shows results from association analysis and the second panel from linkage analysis. The third panel shows results when either linkage or association signal is found in the model, and the case when both association and linkage signals are found simultaneously in the model is in the fourth panel.

