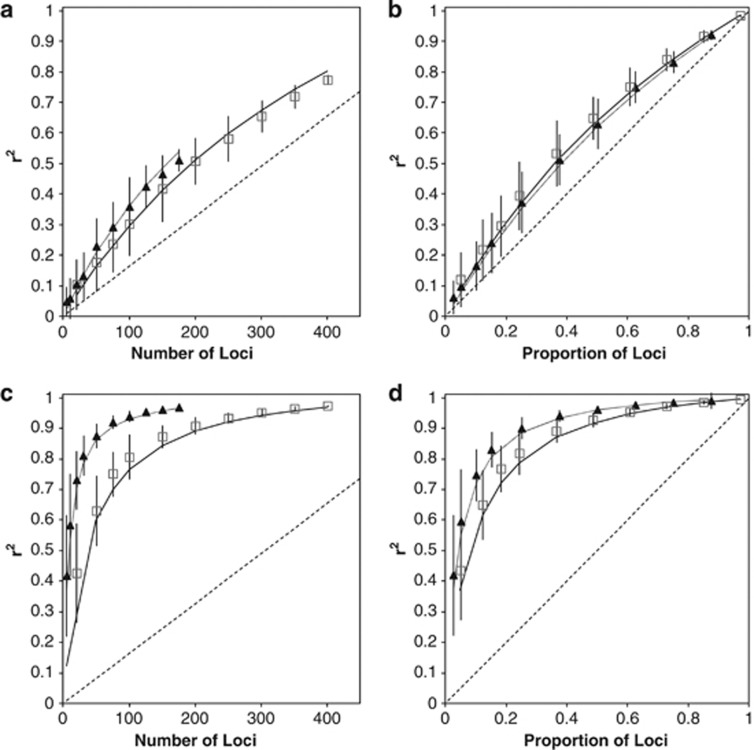
Figure 4.
Average r2 between marker subset stMLH and genome-wide stMLH. Each subset was generated by sampling markers from the total data set 100 times; error bars show s.d. Plots A and C show correlations for SNPs (open squares) and microsatellites (filled triangles) when all 612 loci are considered in RM and NBR, respectively. Plots B and D show correlations when subsets are compared with stMLH exclusively from the same marker type in RM (b) and NBR (d). Note that the x axis is now scaled as a proportion of the total number of either SNPs or microsatellites. Predicted correlations based on Equation 8 are shown for SNPs (solid lines) and microsatellites (dotted lines), dashed lines show predicted correlations among subsets in the absence of identity disequilibrium.

