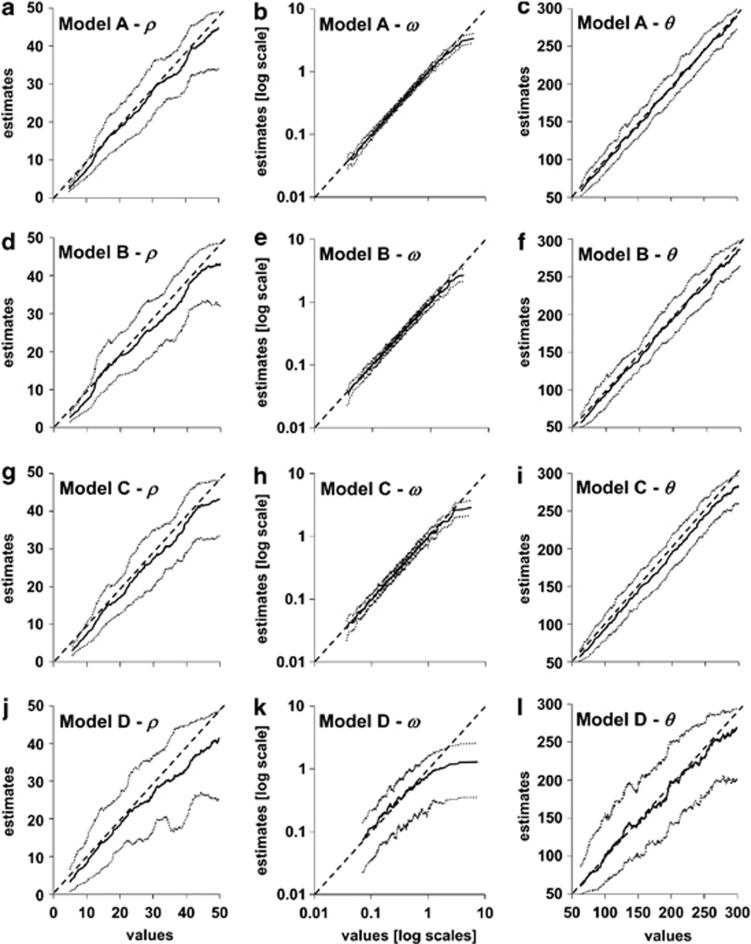
Figure 1.
Accuracy of ABC estimates of ρ, ω and θ rates. The full line indicates the estimated value (y axis) corresponding to each of the 1000 test data sets generated using models A–D under a given true value (x axis). Dotted lines indicate 95% credible intervals. Panels (a) to (l) show results for each parameter of each model as described in the panel's title.

