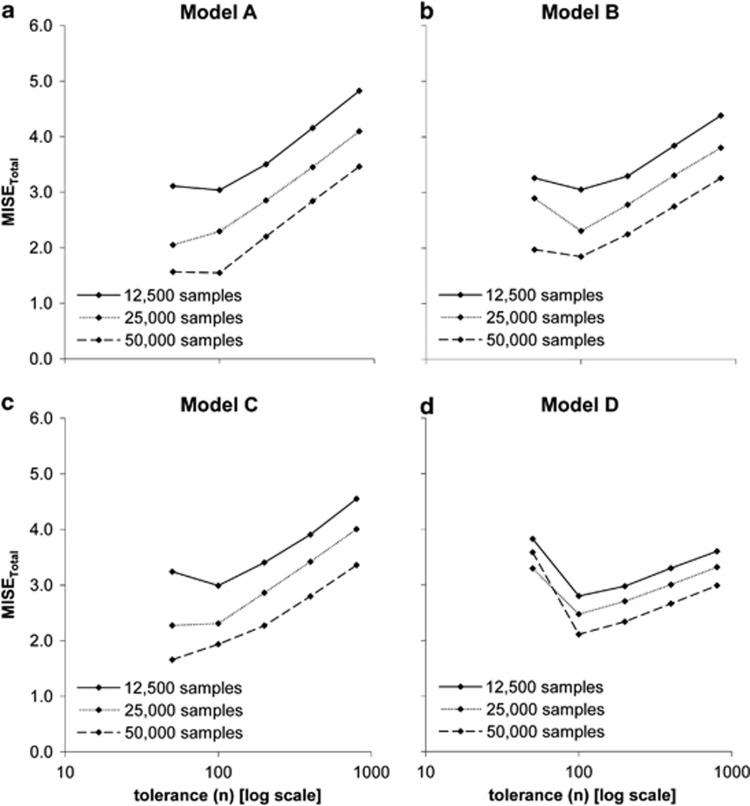
Figure 2.
Effect of number of simulations and tolerance interval on accuracy of ABC using 1000 test data sets generated with models A–D. MISEtotal (y axis) is plotted against different tolerance intervals (x axis) in an analysis with different number of simulated data (12.5k (full line), 25k (dotted line), 50k (dashed line)). (a) Model A. (b) Model B. (c) Model C. (d) Model D.

