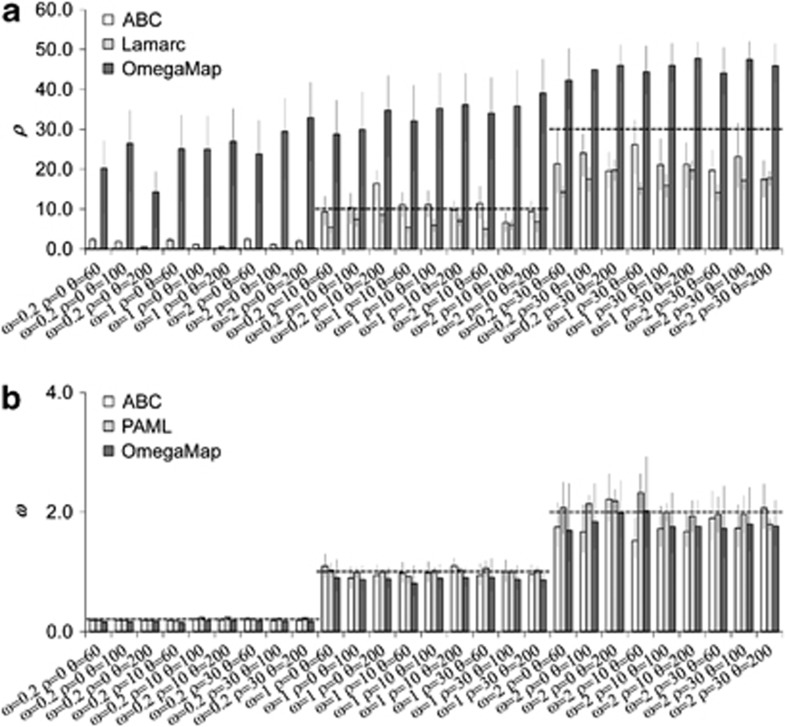
Figure 4.
Comparison of ABC, OmegaMap, Lamarc and PAML estimates from simulated data. Tweenty-seven evolutionary scenarios were generated under different values of ρ, ω and θ (x axes). The height of the bars correspond to the average values over replicates. Error bars indicate 95% credible intervals and horizontal dashed-lines indicate the true value. (a) Estimates of ρ. (b) Estimates of ω.

