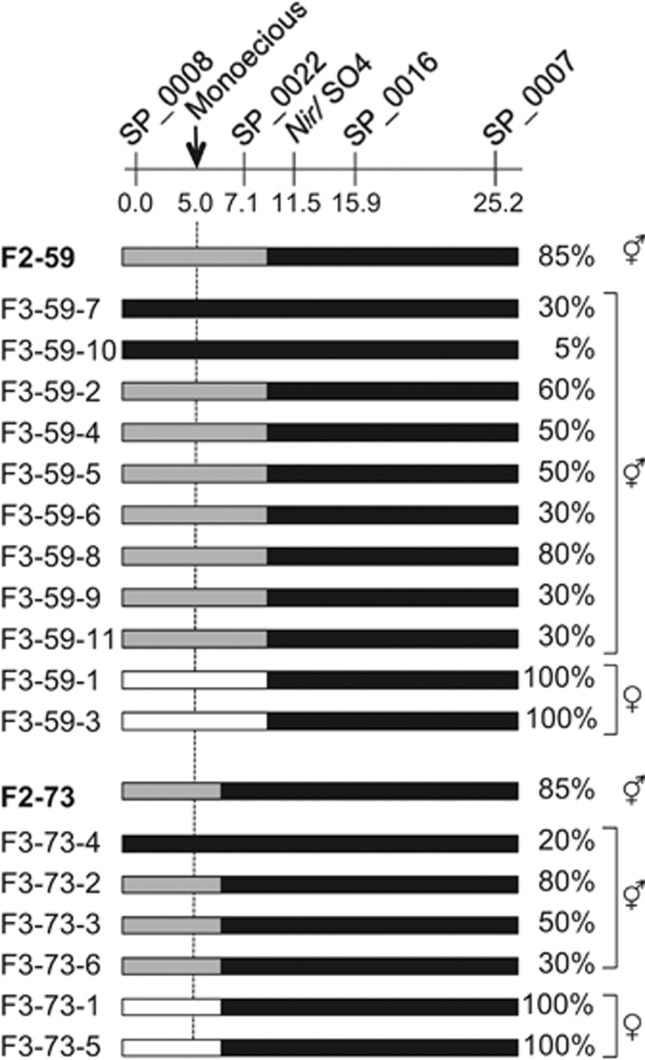
Figure 3.
Graphical genotypes and femaleness of F3 families derived from two selections (F2-73 and F2-59) in 03–009 × 03–336 F2. Black bars represent homozygous 03–336 segments, gray bars indicate heterozygous 03–009/03–336 regions, and white bars represent homozygous 03–009 segments. F3 families are denoted by the prefix ‘F3'. Indexes of femaleness (expressed as the percentage of female flowers per plant) are indicated to the right of the bars. Marker positions (cM) and names are indicated above the bars.

