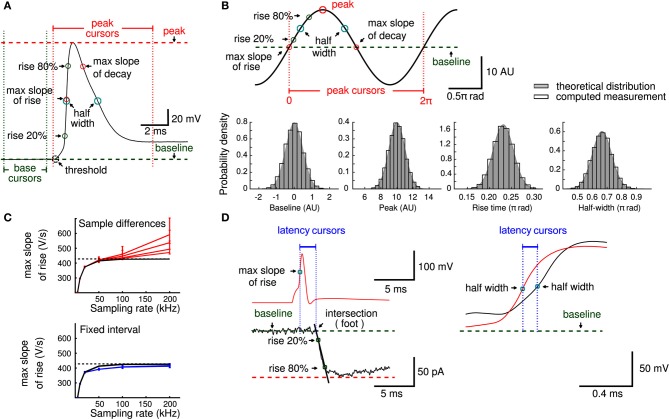
Figure 3.
Principal measurements. (A) An action potential showing baseline (green) and peak (red) cursors that delimit the principal measurements obtained in layer II of the analysis workflow. (B) An example of a trace used to provide analytical solutions to validate principal measurements (peak 10 arbitrary units, rise time 0.23 π rad, half duration 0.66 π rad, max slope 1 and max decay −1). Histograms of baseline, peak, rise time and half duration measurements (open bars) show estimated measurements together with the theoretical distribution used to generate the analytical values (gray). (C) The error to estimate the maximal slope depends on sampling rate and measurement noise. The black line is the expected maximal slope when sampling noise free data, in red are the slope values and its 5 and 95 percentiles obtained when computed slopes from adjacent sampling differences at different noise levels (impedance noise of 10, 20, 50, and 100 MΩ, respectively). Blue lines indicate the slope values calculated from the traces in red, but with a fixed interval (temporal window of 50 μs). Note smaller confidence intervals and lower dependency on the sampling rate. Dashed line indicates the maximal slope value (428.1 V/s) used as reference. (D) Parameters of physiological relevance, like latencies between an action potential (red) and a postsynaptic response (black) or between axonal (red) and somatic (black) action potentials can be computed from principal measurements.

