
Figure 5.
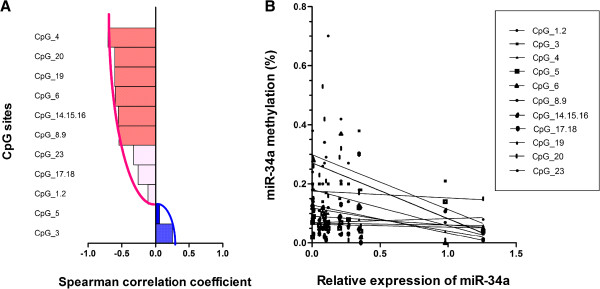
Negative correlation of miR-34a specific CpG units’ methylation and their expression. (A) Bar plot of Spearman correlation coefficient (r) showing strength of negative correlation between miR-34a expression and methylation value of each CpG unit within miR-34a, with negative values representing inverse correlations and positive values representing positive correlations. Significant correlations (P < 0.05) are indicated in red. (B) Analysis of scatterplots and simple linear regression graphically displaying the correlation between methylation level of each CpG unit and miR-34a gene expression in Kazakh ESCC samples by Spearman correlation coefficient analysis. The straight line was the “best fit” that indicated the trend of relationship.