Figure 2.

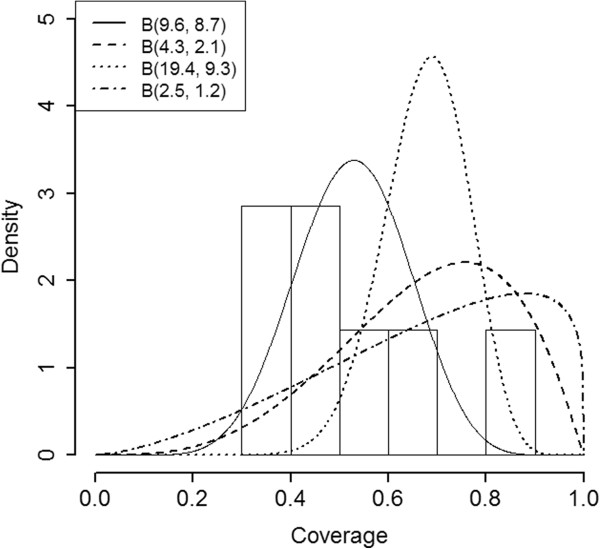
Prior Distributions. Prior distributions used in the ORS survey design sensitivity analysis. The histogram represents a plot of the actual data across the 7 SAs in January 1999.

Prior Distributions. Prior distributions used in the ORS survey design sensitivity analysis. The histogram represents a plot of the actual data across the 7 SAs in January 1999.