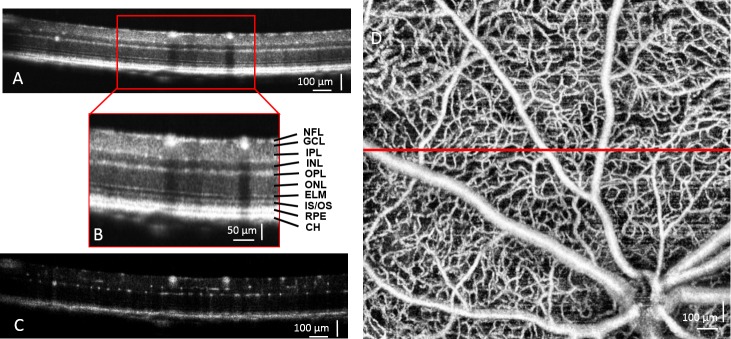
Figure 1.

Ultrahigh-resolution OCT/OMAG images from a normal WT BTBR mouse are shown. Cross-sectional OCT structural image of the retina (A) and higher magnification (B, inset) demonstrate the resolved retinal and choroidal layers. CH, choroid; ELM, external limiting membrane; GCL, ganglion cell layer; INL, inner nuclear layer; IPL, inner plexiform layer; IS/OS, junction between the inner and outer segment of the photoreceptors; NFL, nerve fiber layer; ONL, outer nuclear layer; OPL, outer plexiform layer; RPE, retinal pigment epithelium layer. (C) Corresponding cross-sectional blood flow image was obtained by comparing the 5 repeated B frames captured at the same cross-section. (D) Maximum intensity projection map shows mouse retinal microvasculature, generated by OMAG. The red line indicates where the cross-section is shown in (A).
