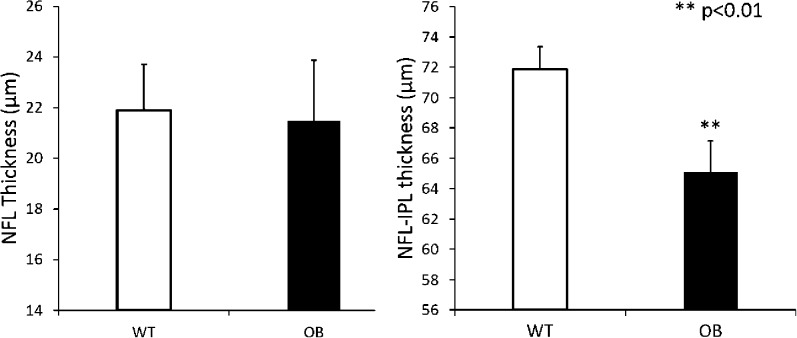
Figure 3.
Decrease in NFL–IPL thickness in OB mouse retinas are compared to those in WT mouse retinas. Left: Mean thicknesses of NFL in WT control mice (n = 10) and diabetic OB mice (n = 10) are shown. No statistical differences were observed between the two groups. Right: Mean thicknesses of NFL–IPL in WT control mice (n = 10) and diabetic OB mice (n = 10) are shown, with the NFL–IPL thickness measured from the retinal surface to the posterior limit of the IPL layer. **P < 0.01 between the two groups. Data are means ± SE.

