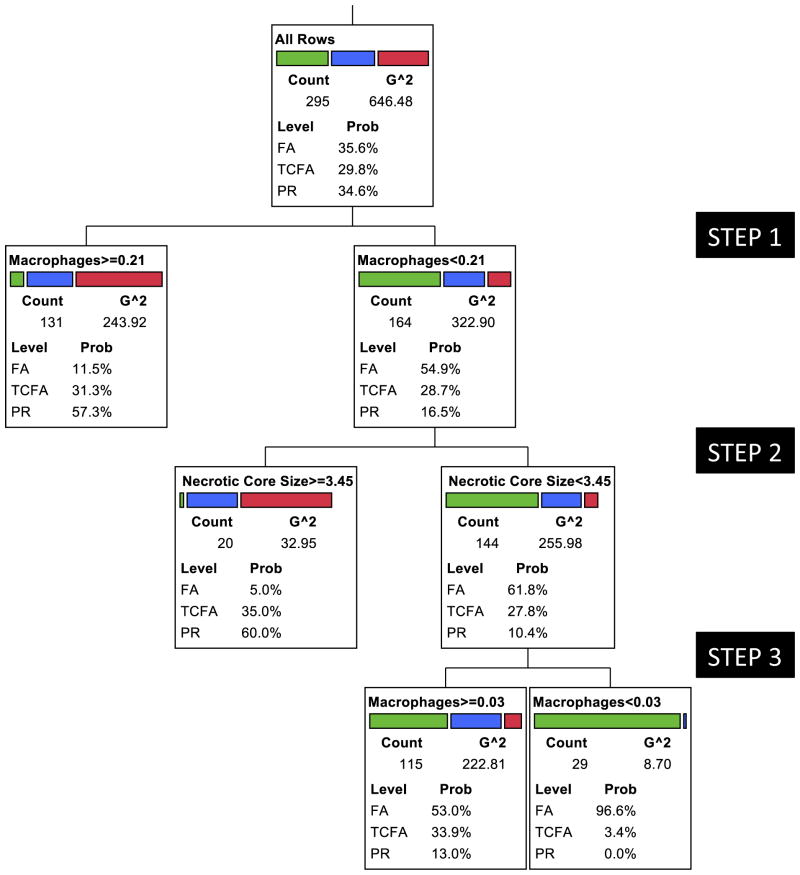
Figure 5. Multivariate RPA Model Including All Cases But Excluding Cap Thickness as the Candidate Variable.
Predominance of macrophage infiltration identified a majority of PR (red) and TCFA (blue). TCFA and PR in the less-inflamed group (contaminating the FA group) showed larger NC. The few remaining less inflamed and small core PR and TCFA could be isolated from FA (green) once again by the degree of inflammation. The receiver-operating characteristic curve generated from the analysis suggested the following area under the curve: FA, 0.82; TCFA, 0.58; and PR, 0.72. Essentially, similar results were observed in re-analysis including only the lesions showing 50% to 75% luminal diameter stenosis; area under the curve: FA, 0.81; TCFA, 0.70; and PR, 0.85. The results were similar for those with >75% diameter stenosis; area under the curve: FA, 0.86; TCFA, 0.59; and PR, 0.82. Abbreviations as in Figures 1 and 4.

