
Figure 1.
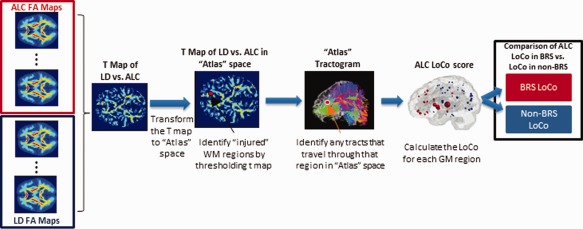
Pipeline process for calculating LoCo scores using “atlas” tractograms from a healthy young control group and t‐maps from ALC versus LD FA measures. [Color figure can be viewed in the online issue, which is available at http://wileyonlinelibrary.com.]