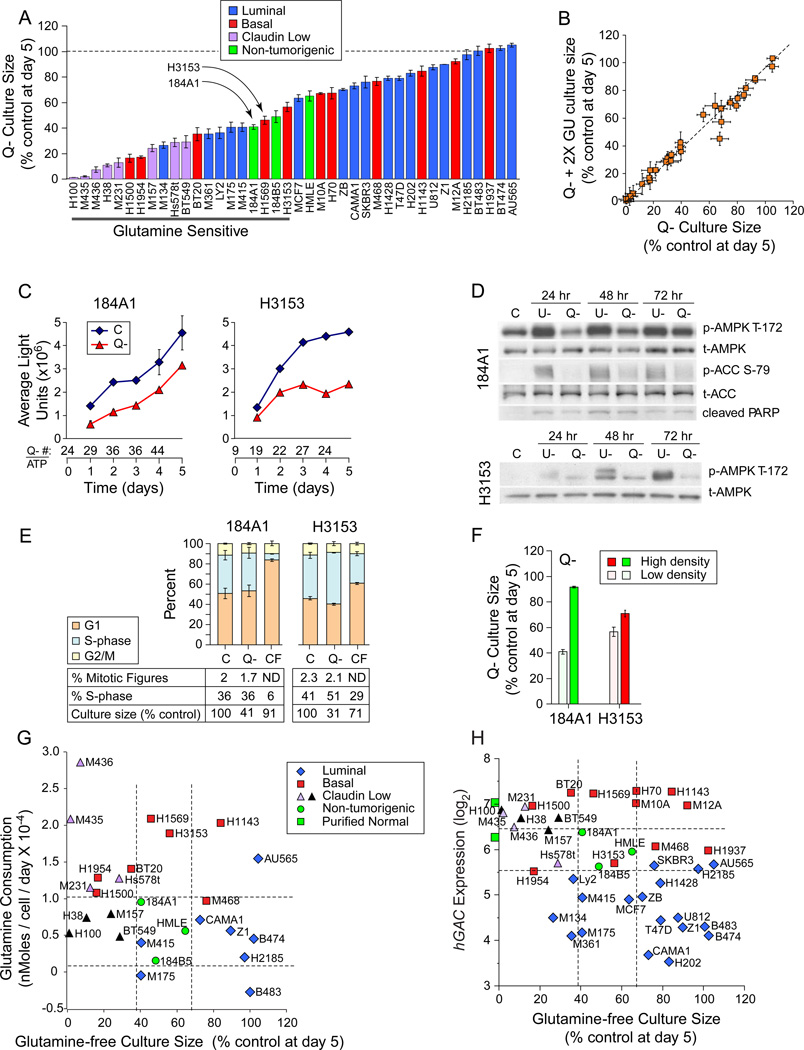
Figure 2. Glutamine Restriction Slows Culture Expansion.
Icon codes in figure keys; dotted lines bracket non-tumorigenic sample values; C, complete media; Q-, glutamine-free media; U-, glucose free media. Icons represent mean values +/−SD. (A) Day 5 culture sizes for each cell line grown in glutamine-free media, normalized to culture in control media. (B) Day 5 culture sizes in glutamine-free media with twice the normal glucose concentration (2X GU, y-axis) vs. glutamine-free media with normal glucose levels (x-axis), each normalized to culture in control media. (C-F) Glutamine deprivation responses in the non-tumorigenic exemplar 184A1 and a similarly-sensitive tumorigenic line H3153 (arrows, panel A). (C) Growth curves derived from Cell Titer Glow/ATP content analysis. Numbers below the x-axis, ratio of cell number derived from manual counting (trypan blue) / ATP values. (D) Comparison of AMPK activating phosphorylation, PARP cleavage, and ACC inhibitory phosphorylation. (E) Cell cycle distribution, mitotic figure counts, S-phase fractions, and culture sizes at day 5 culture in indicated conditions. CF, confluent cells in complete media. (F) Day 5 culture sizes differences for high density vs. low density cultures in glutamine-free media. (G) Glutamine consumption (from Figure 1D) vs. glutamine-free culture sizes from part A. (H) hGAC GeneChip hybridization signal vs. glutamine-free culture sizes from part A. Green squares on y-axis are the average hGAC hybridization signals from 3 CD10+, and 3 BerEP4+ purified normal breast samples. See also Figure S2.

