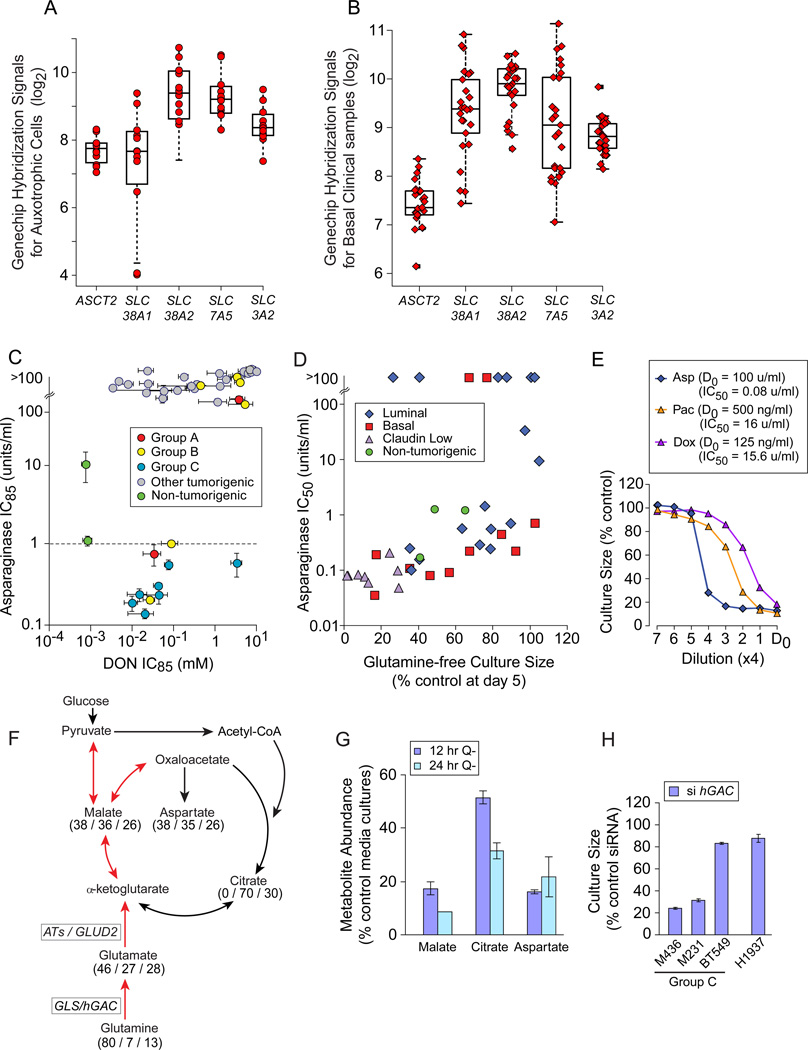
Figure 5. Glutamine Auxotrophy Presents Therapeutic Opportunities.
Icons represent mean values+/−SD. (A) GeneChip hybridization signals for 4 glutamine transporters and the common heavy chain (SLC3A2) in glutamine auxotrophic cells. (B) GeneChip hybridization signals for transporters as in panel A, for basal carcinoma subsets of clinical datasets downloaded from NCBI GEO and Chin 2006 (Chin et al., 2006), 1 example dataset shown. (C) Relative Asparaginase (y-axis), and DON (x-axis) sensitivities (IC85) of our cell panel, coded by restriction Groups B and C vs. others; dotted line, Asparaginase concentration used to kill sensitive leukemia cells in vitro (1u/ml). (D) Day 5 glutamine-free culture sizes (from Figure 2A) vs. Asparaginase sensitivity (IC50 shown). (E) Four fold drug titrations and calculated IC50s for an exemplar Group C auxotroph (M436). D0, highest drug concentration and calculated IC50s in figure key; Asp, Asparaginase; Pac, Paclitaxel; Dox, Doxorubicin. (F) TCA cycle diagram illustrating respiratory use of glutamine in red arrows. Numbers indicate mass spectroscopy determination of the percent of each metabolite that contains (all / several / no) 13C-carbons derived from culture with 13C-5-glutamine in M436. (G) Decrease in key TCA cycle metabolite pools with glutamine restriction, expressed as % control media cultures; Q-, glutamine-free media. (H) Proliferative effects of siRNA-mediated hGAC mRNA reduction in exemplar cell lines, expressed as a percent of transfection with a scrambled siRNA. See also Figure S5, Tables S6, S7.

