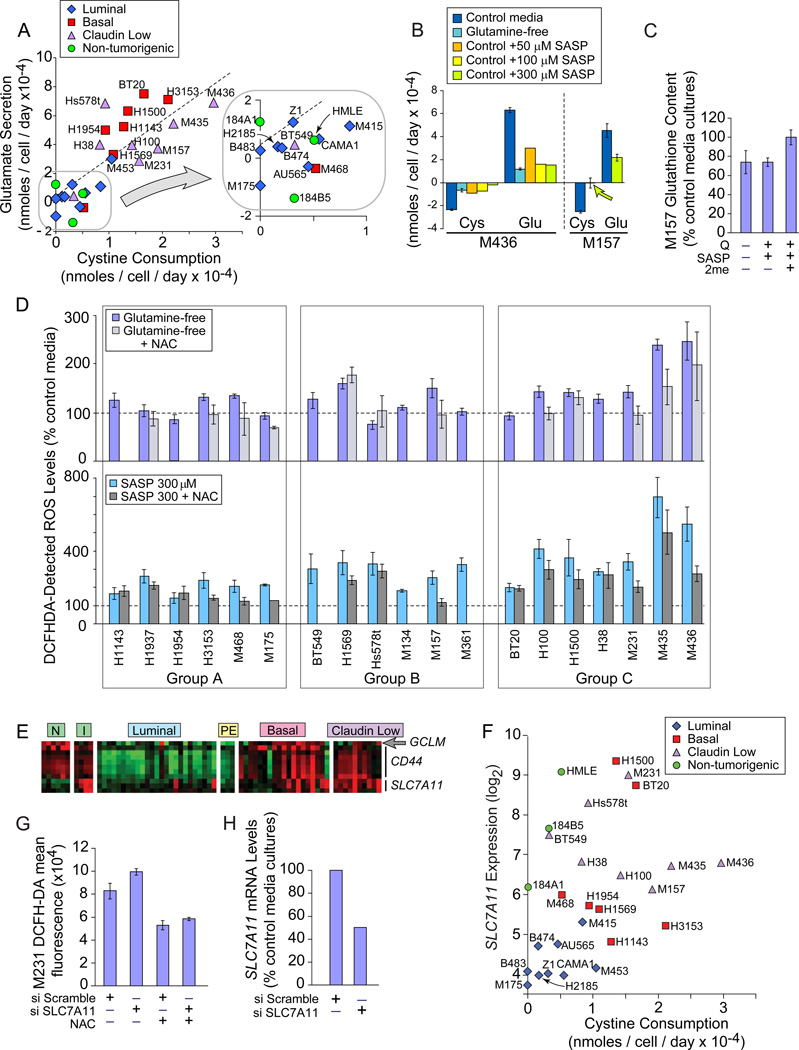
Figure 6. Glutamine Restriction and xCT Inhibition Increase ROS.
Icon codes in figure keys; NAC, N-acetylcystine; SASP, Sulfasalazine. Icons represent mean values+/−SD. Amino acid quantitation by HPLC. (A) Change in media cystine (xaxis) and glutamate (y-axis) concentrations of cells cultured 24 hours in control media. (B) 24 hrs of glutamine restriction or SASP treatment reduces cystine / glutamate exchange by exemplar Group C auxotrophs; cys, cystine; glu, glutamate. (C) Effects of 24 hour glutamine restriction or SASP treatment on GSH content in an exemplar Group C TNBC; Q-, glutamine-free media; SASP, SASP treatment in complete media; SASP + 2me, SASP treatment in the presence of beta mercaptoethanol. (D) ROS levels in basal carcinomas assessed by DCFHDA fluorescence, normalized to control media reactivity. Light blue, 2 day cultures in glutamine-free media; Group averages; A, 112% +/− 21; B, 121% +/−31; C,162% +/−59; t-test group A vs. C p=0.07; Group A vs. B+C p= 0.074. Light gray, glutamine-free media +NAC. Teal, cultures treated 24 hours with SASP; Group averages; A, 205% +/− 43; B, 287% +/− 62; C, 405% +/− 168; t-test Group A vs. C p= 0.019; Group A vs. B+C p= 0.003. Dark gray, SASP +NAC. (E) Heatmap of genes involved in xCT function; red, increased; green, decreased; N, purified normal CD10+ and BerEp4+ breast epithelial cells; I, proliferating non-tumorigenic cell lines; PE, ER+ tumor cells purified from pleural effusions. (F) SLC7A11 GeneChip hybridization signal (log2) vs. cystine consumption, icons coded by molecular subtype. (G) ROS levels in M231, 48 hours after targeting SLC7A11 or a scrambled siRNA, in the presence or absence of N-acetylcystine (NAC). (H) SLC7A11 knockdown efficiency of siRNAs used in part G. See also Figure S6.

