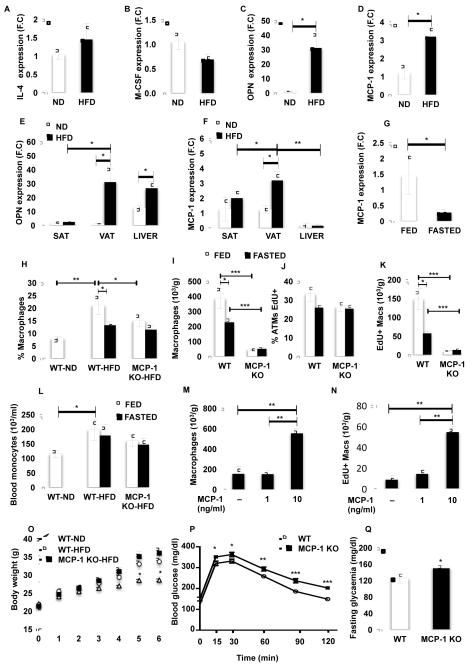
Figure 4. MCP-1 is required for optimal adipose tissue macrophage proliferation.
See also Figure S4. VAT was isolated from mice fed a ND or HFD for 7 weeks. (A) IL-4, (B) M-CSF, (C) OPN and (D) MCP-1 expression was measured by RT-PCR. n=5. (E) Expression of OPN and (F) MCP-1 in SAT, VAT and liver from mice fed a ND or HFD for 7 weeks. n=5. (G) Expression of MCP-1 in VAT of mice fed a HFD for 7 weeks and fasted for 24 hours. (H) Percentage and (I) number of macrophages in SVF from VAT of MCP-1 KO and WT mice fed a HFD for 6 weeks and fasted for 18 hours. n=5. (J) Percentage and (K) number of EdU+ macrophages in AT of MCP-1 KO and WT mice. (L) Number of blood monocytes in MCP-1 KO and WT mice. Explants from VAT of 5 ob/ob mice were treated with 1 and 10 ng/ml of MCP-1 in presence of 10 μM of EdU for 48 hours. Graph represents the number of (M) macrophages and (N) EdU+ macrophages in explants. (O) Body weight of MCP-1 KO and WT mice fed a HFD for 6 weeks. (P) GTT and (Q) fasting glycaemia. All graphs are expressed as mean ± s.e.m. Statistical significance was determined by Student’s t-test or two-way ANOVA followed by Tukey post-test. ***p<0.001; **p<0.01; *p<0.05.

