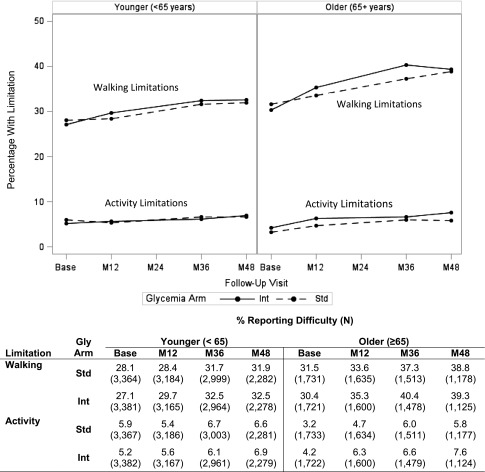
Figure 2.
Plots represent the proportion of participants reporting difficulty with either walking or activities at each follow-up visit. In the table below the figure, the number of participants providing data at each time point is presented in parentheses, after the percentage of participants reporting difficulty. M12, month 12; M24, month 24; M36, month 36; M48, month 48; Int, intensive; Std, standard; Gly, glycemia.

