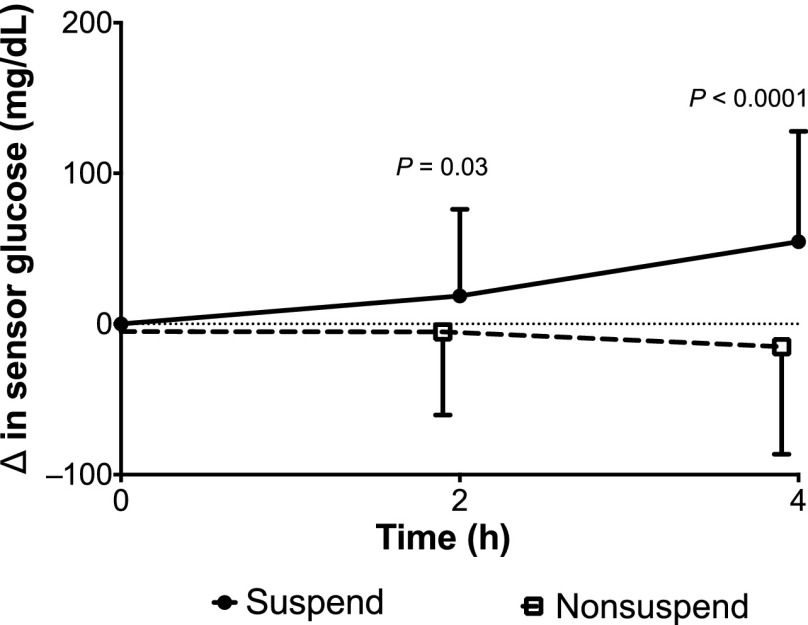
Figure 3.
Change in sensor glucose levels. Change in sensor glucose value (in milligrams per deciliter) is compared on suspend night (solid circles with solid line) vs. nonsuspend nights (open boxes with dashed line). Sensor glucose levels at the start of a suspend period (0 h), the end of the suspend period (2 h), and 4 h after the initiation of a suspend period (4 h) are noted. On nonsuspend nights, sensor glucose levels were assessed at time periods that would coincide with suspend nights (i.e., 11:30 p.m.–1:30 a.m. or 2:00–4:00 a.m.).

