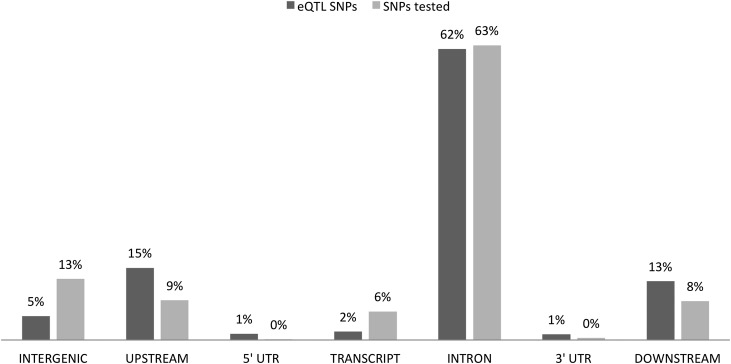
Figure 3.
Functional annotation of eQTL SNPs. The bars indicate the percentages of eQTL SNPs per gene functional unit and their enrichment or depletion relative to all SNPs tested in this study. The SNPs were annotated with snpEff. Downstream and upstream regions are defined as being within a 5-kb distance from a gene.

