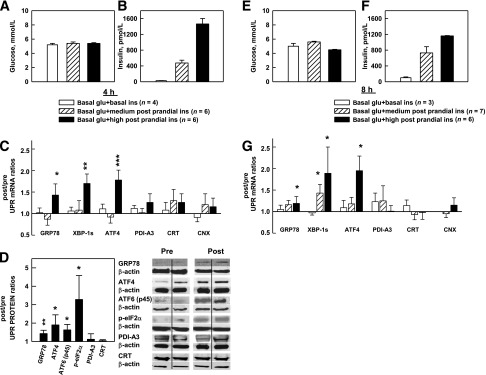
Figure 1.

A–D: Effects of three levels of euglycemic-hyperinsulinemia for 4 h on UPR mRNA and proteins. A and B: Steady-state (120–240 min) plasma glucose and insulin concentrations in nondiabetic volunteers during three 4-h euglycemic clamp studies with three different steady-state insulin levels. C: Sc fat biopsies were obtained surgically immediately pre– and post–clamp studies. Shown are after/before mRNA ratios of six UPR markers in response to euglycemia associated with basal (n = 4, ∼70 pmol/L), medium postprandial (n = 6, ∼480 pmol/L), and high postprandial (n = 6, ∼1,450 pmol/L) insulin concentrations. Shown are the means ± SE of 18S normalized mRNA values. *P < 0.05, **P < 0.02, ***P < 0.01 compared with after/before ratios of 1.0. D: Mean of six after/before UPR protein ratios (left) and two representative Western blots each of the UPR proteins (right) in response to high postprandial insulin concentrations. Shown are means ± SE. *P < 0.05, **P < 0.02 compared with after/before ratios of 1.0 (paired Student t test). E–G: Effects of three levels of euglycemic-hyperinsulinemia for 8 h on UPR mRNA. E and F: Steady-state plasma glucose and insulin concentrations during three 8-h euglycemic clamp studies with three different steady-state insulin levels. G: Mean after/before mRNA ratios of 6 UPR markers in response to basal (n = 3), medium postprandial (n = 6), and high (n = 7) postprandial insulin concentrations. Shown are mean ± SE. *P < 0.05 compared with after/before ratios of 1.0 (paired Student t test). glu, glucose; ins, insulin.
