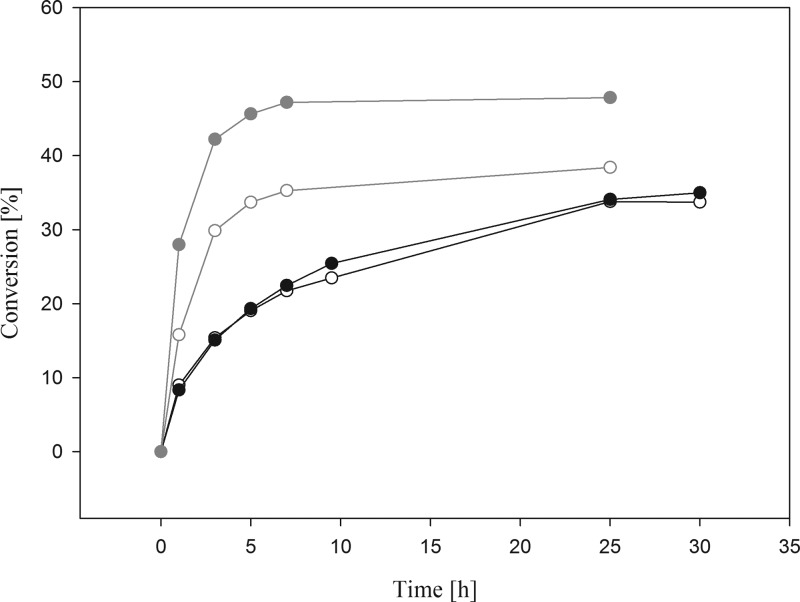
Figure 4.
Time course of d-tagatose (black symbols) and d-fructose (gray symbols) production during l-AI- and d-XI-catalyzed isomerization of d-galactose and d-glucose, respectively: black, open circle) conversion curve at 60 °C performed with 0.9 mg of l-AI (expressed in pSIP609 L. plantarum); (black, solid circle) conversion curve at 60 °C performed with 1.0 mg of l-AI (expressed in pET21-a(+) E. coli); (gray, open circle) conversion curve at 60 °C performed with 0.9 mg of d-XI (expressed in pSIP609 L. plantarum); (gray, solid circle) conversion curve at 60 °C performed with 1.9 mg of d-XI (expressed in pET21-a(+) E. coli).

