
Figure 4.
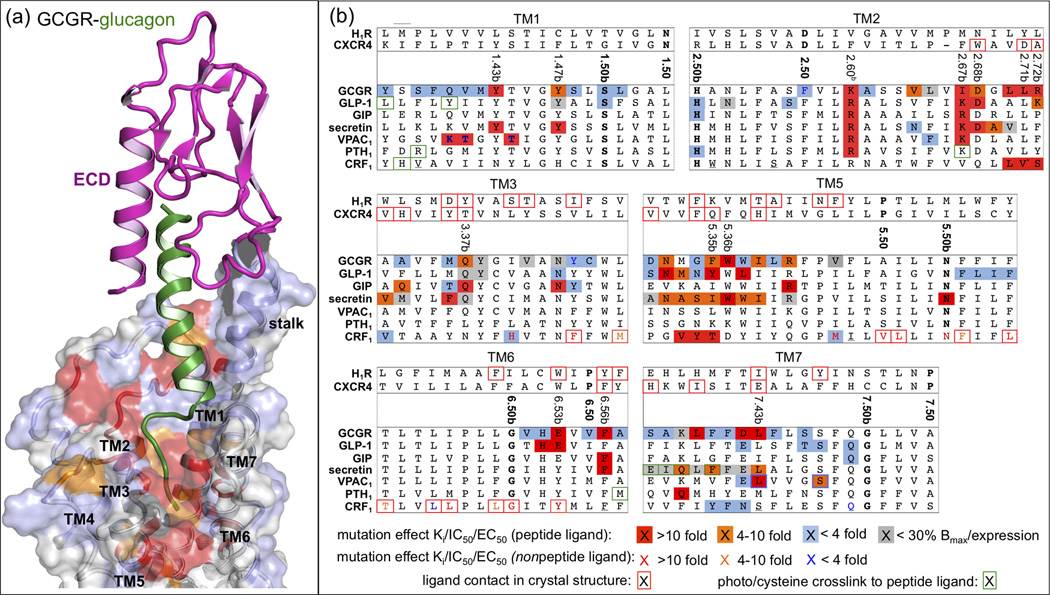
(a) Model of full GCGR-glucagon complex [11]. GCGR with the ECD (PDB ID 4ERS, in magenta) and TMD (PDB ID 4L6R, transparent surface) bound to glucagon (green). The effects of mutation studies of individual GCGR residues on glucagon binding are mapped onto the GCGR binding surface using the color coding presented in Figure 4b. (b) Effects of mutation studies in GCGR, GLP-1, GIP, secretin, VPAC1, PTH1, and CRF1 receptors [10,11,14,21,22,26,29–35,39–53] are mapped on a structure-based (Figure 3b) sequence alignment between representative class A GPCR crystal structures (H1R and CXCR4) and representative class B GPCRs. Only specific parts of TM1–3 and TM5–7 are shown, separated by grey dashed lines. Mutated residues that show <4 fold (blue), 4–10 fold (orange), and >10 fold (red) changes of Ki/IC50 values for ligand binding (or ligand potency/EC50 value if no Ki/IC50 value has been reported) are marked (peptide ligands) and colored (non-peptide ligands). Mutants that show receptor expression <30% of wild-type are marked grey. Ligand contact residues in CRF1 (Figure 1c), H1R, and CXCR4 crystal structures are boxed red. The most conserved residues in TM1–7 of class A (x.50) and class B (x.50b) GPCRs (Box 1, Figure 3a) are shown in bold. Receptor residues that covalently bind peptide ligands in photo cross-linking or cysteine trapping studies [22,25,47,50,54,69,70] are boxed green. Note that several mutation and photo cross-linking studies annotated for secretin and PTH receptors are performed with rat orthologs. Residues that are mutated in the conformationally thermostabilized [10] CRF1 crystal structure are underlined.