
Fig. 5.
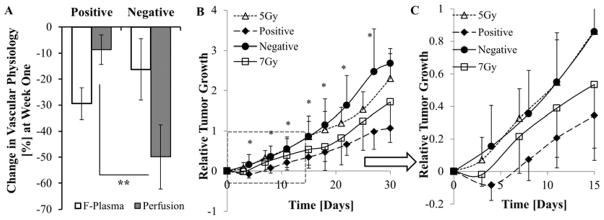
(A) Average percentage change in perfusion and Fp for the positive (n=4) and negative (n= 5) responding tumors 1-week post-DC101 treatment are compared to corresponding baseline values. (B) Average relative growth in the positive and negative responding tumors is compared to 5 and 7 Gy RT groups. (C) Represents the portion inside the dashed line rectangular in Fig. 5B, which highlights the reduced variance and statistical significance in the early tumor growth delay response. (* P<0.05; ** P<0.01; error bar:±SD)