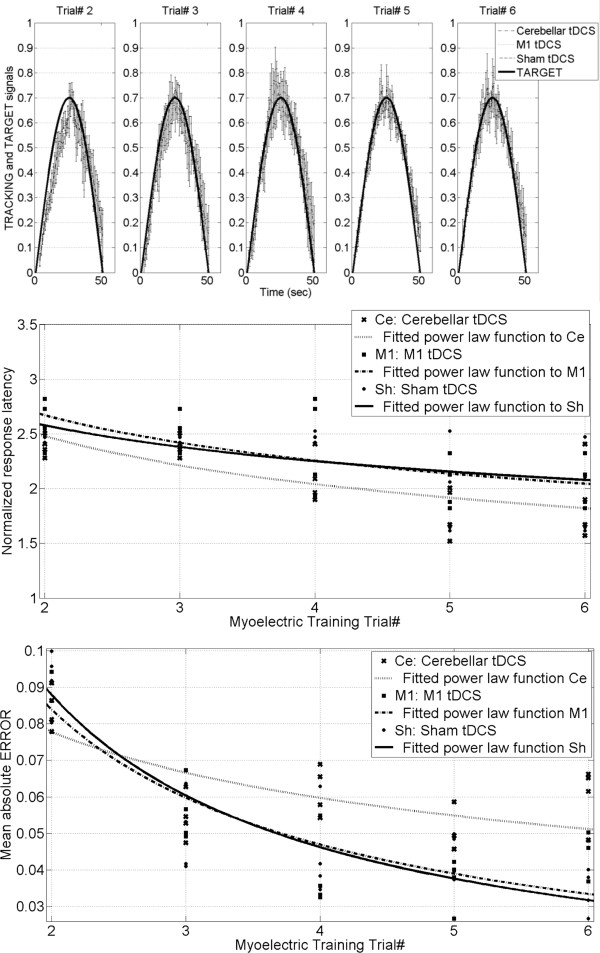
Figure 6.
Results from myoelectric the visual pursuit task (i.e., Experiment 2) for Myoelectric Training Trial# 2–6 for the tDCS groups: M1, cerebellum, sham. The top row illustrates the overall TARGET and TRACKING signals during the modulation of EMG during 'proportional EMG control’ trials, the middle row shows the effects on the normalized response latency, and the bottom row shows the effects on the mean absolute ERROR.

