
Figure 4.
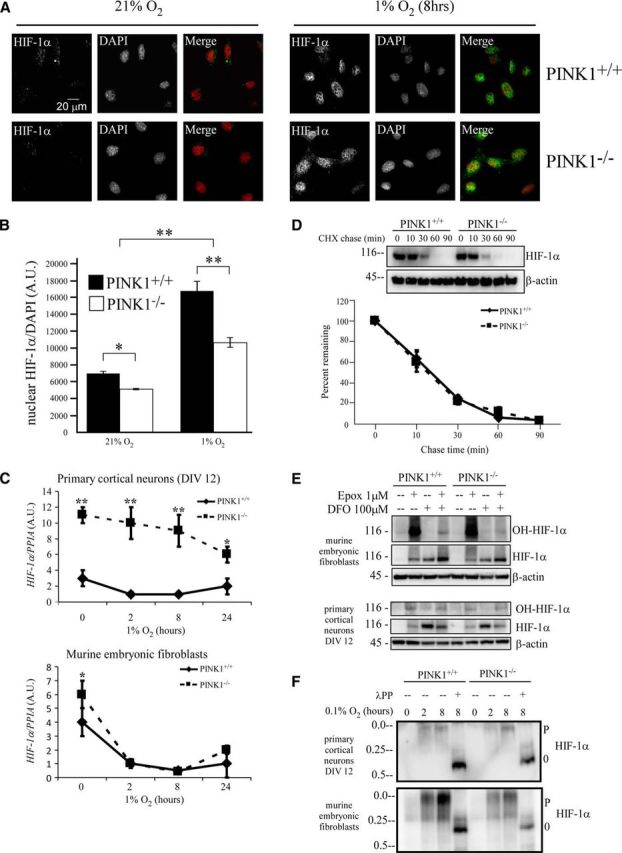
Characterizing the effects of PINK1 on HIF-1α. A, HIF-1α translocates to nucleus in PINK1+/+ and PINK1−/− MEFs during hypoxia. Cells were treated with 1% O2 for 8 h, fixed, and stained for HIF-1α (in green) and nucleus with DAPI stain (in red). B, Quantification of nuclear HIF-1α signal from A. C, PINK1−/− cells do not have lower levels of HIF-1α mRNA. RNA was collected from PINK1+/+ and PINK1−/− cells after being treated with 1% O2 for 0, 2, 8, and 24 h. HIF-1α mRNA level was quantified with RT-qPCR and normalized to PPIA mRNA from four independent experiments. *p value < 0.05, **p value < 0.01. D, HIF-1α degradation rate under hypoxia remains unchanged in the absence of PINK1. PINK1+/+ and PINK1−/− MEFs were exposed to 1% O2 for 2 h before 60 μg/ml CHX was added to inhibit de novo protein synthesis in hypoxia for up to 90 min. HIF-1α level was normalized to β-actin level and the percentage remaining was calculated by dividing each chase time point into its time 0. Data pooled from six independent experiments. E, HIF-1α hydroxylation occurs in PINK1−/− cells. PINK1+/+ and PINK1−/− MEFs and primary cortical neurons were treated with 1 μm epoxomicin (Epox) with or without 100 μm of the hypoxia mimic DFO for 8 h. Cell lysates were analyzed by Western blot for hydroxy-HIF-1α, HIF-1α, and β-actin as a protein loading control. A representative figure from two independent experiments is shown. F, Hypoxia induces HIF-1α phosphorylation in both PINK1+/+ and PINK1−/− cells. PINK1+/+ and PINK1−/− MEFs and primary cortical neurons were treated with 0.1% O2 for 0, 2, and 8 h. Cell lysates were analyzed by Phos-tag Western blot for HIF-1α phosphorylation. P denotes phospho-form; 0 denotes unphospho-form. A representative figure from two independent experiments is shown. A.U., arbitrary units.