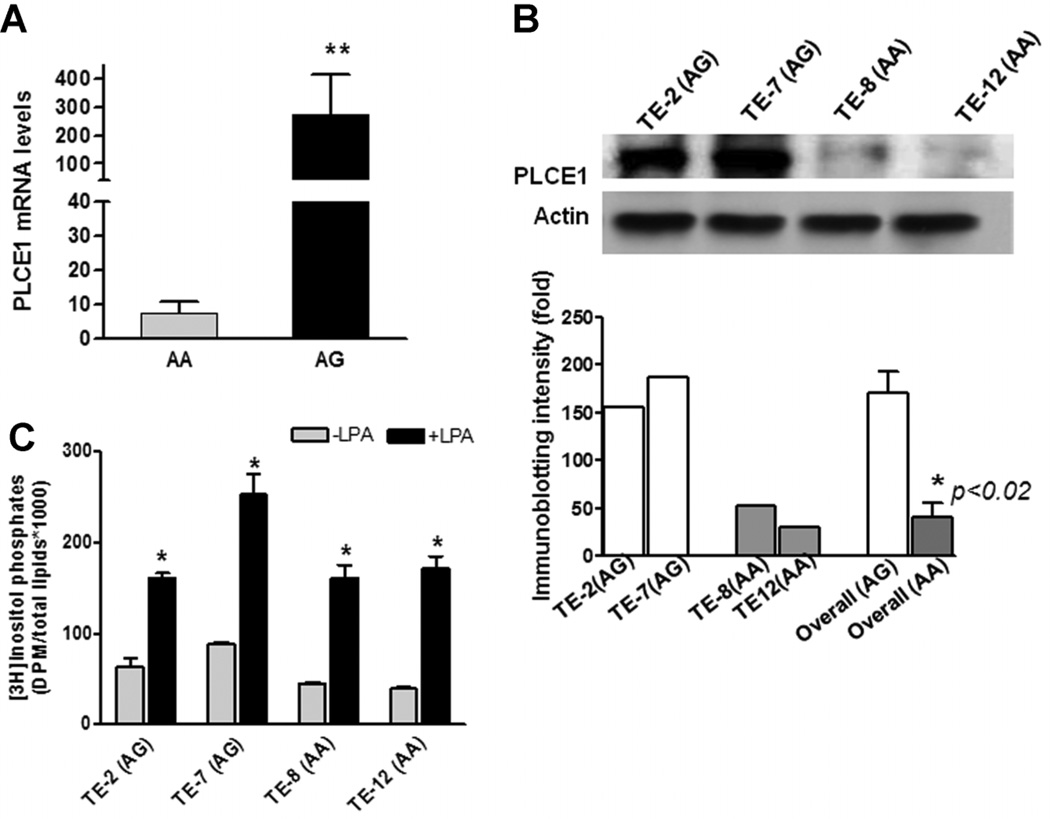
Figure 1.
Correlation of A5780G genotypes with PLCε mRNA, total protein and enzyme activity levels in SCC cell lines. (A) Quantitative determination of PLCε mRNA levels in SCC cell lines (n = 13) by qRT-PCR. Bars represent the mean ± SD for each tumor type. **P < 0.01. (B) A representative of immunoblotting showed that PLCE1 protein levels were higher in AG cell lines (TE-2 and TE-7) and were lower in AA cell lines (TE-8 and TE-12), using specific anti-PLCε antibody. Histograms showed immunoblotting intensities quantified by Quanty One software (Bio-Rad, Hercules, CA). *P < 0.02, overall (average) intensity of PLCE1 protein in AG cell lines in comparison with those in AA cell lines. (C) PLCε enzymatic activity was determined by measurement of [3H] inositol triphosphate in esophageal cancer cells with AA and AG alleles. Endogenous PLCε baseline activity (gray bars) was nearly twice as high in the two AG cell lines (TE-2 and TE-7) than those in the two AA cell lines (TE-8 and TE-12) (76 ± 20 vs. 42 ± 7, P < 0.05). LPA was used as a ligand to stimulate PLCε activity, and PLCε activities were significantly induced (black bars). Bars represent the mean ± SD for three replicates of experiments performed. *P < 0.001, compared to individual cell line without LPA treatment.

