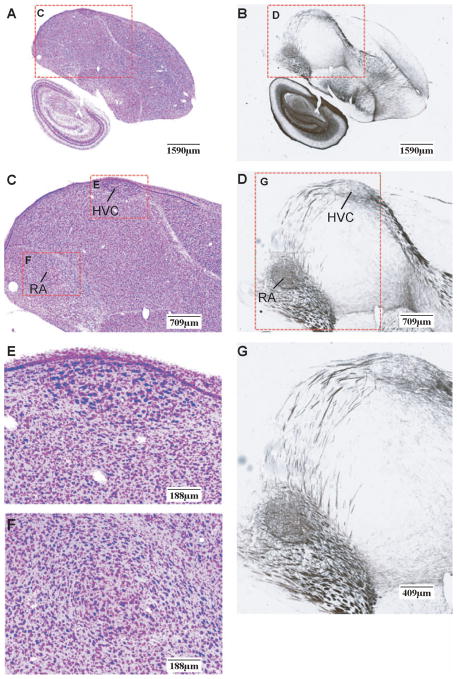
Figure 4. Multi-resolution views of adjacent Nissl- and myelin-stained sections.
(A and B) Low magnification images of adjacent brain sections stained for Nissl (A) and myelin (B). Sections depicted at a level that includes song nuclei HVC and RA. Regions of interest (ROI) presented at higher magnification in panels C and D are indicated by the red dotted squares. (C and D) High power shots of the ROIs defined in A and B. (E and F) High power shot of HVC (E) and RA (F) from panel C illustrating the fine cytoarchitectonic features of the posterior vocal control nuclei of the song system. (G) High power shot (from panel D) depicting the fine myeloarchitectonic features of the axonal projection from HVC to RA. Scale bars are shown at the lower right corner of each image. For anatomical abbreviations, see list.

