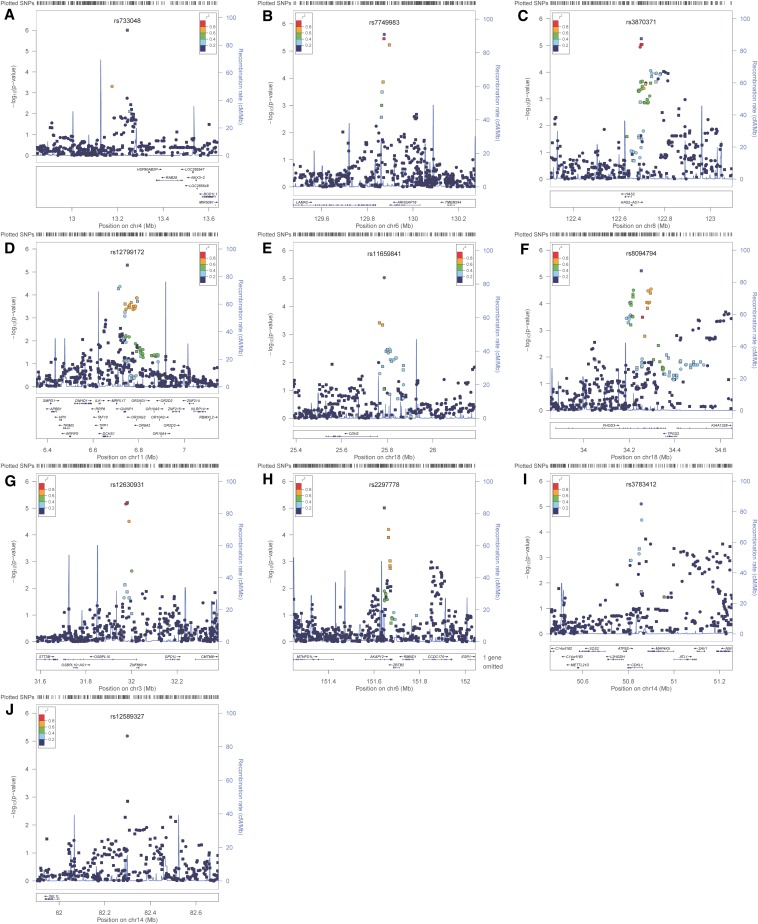
Figure 3.
Negative log10 transformed P-values and physical positions for SNPs in associated regions. Suggestive associations for PD1: (A) SNPs on chromosome 4 occurring near the HSP90AB2P, RAB28, BOD1L, and NKX3-2 genes. (B) SNPs on chromosome 6 occurring near the LAMA2 and ARHGAP18 genes. (C) SNPs on chromosome 8 occurring near the HAS2 and HAS2AS genes. (D) SNPs on chromosome 11p15. (E) SNPs on chromosome 18 occurring near the CDH2 gene. (F) SNPs on chromosome 18 near the FHOD3, TPGS2, and KIAA1328 genes. Suggestive associations for PD2: (G) SNPs on chromosome 3 near the OSBPL10, ZNF860, GPD1L, CMTM8, and STT3B genes. (H) SNPs on chromosome 6 near the MTHFD1L, AKAP12, ZBTB2, RMND1, and ESR1 genes. (I) SNPs on chromosome 14 near the SOS2, L2HGDH, ATP5S, CDKL1, MAP4K5, ATL1, SAV1, and NIN genes. (J) SNPs on chromosome 14 near the SEL1L gene. Colors indicate LD between the index SNP (purple) and other SNPs based on HapMap CEU data. The rug plot indicates regional SNP density. The recombination rate overlay (blue line, right x-axis) is based on HapMap CEU data. Gene positions and directions of transcription are annotated based on hg19/1000 Genomes Nov 2010 release.

