Figure 2.
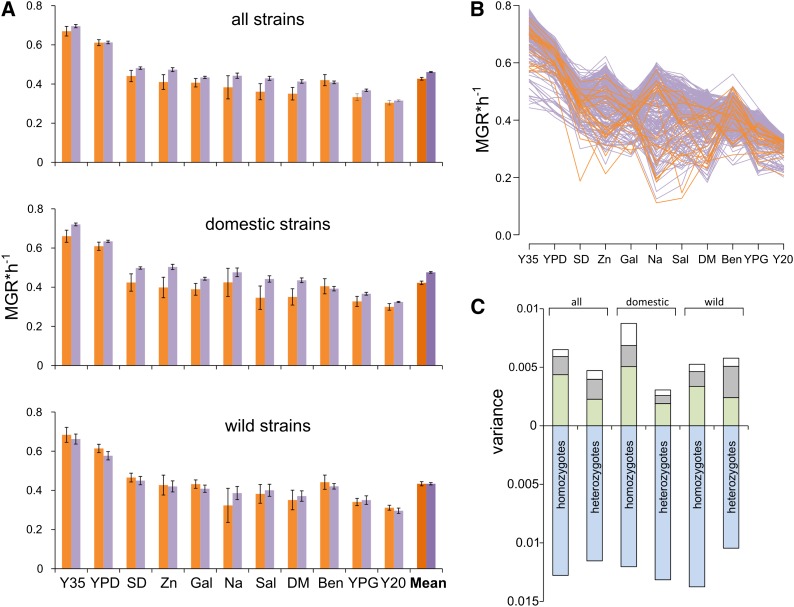
Determinants of phenotypic variation. Fitness was estimated as the maximum growth rate (MGR) in 11 test environments, here ordered according to descending average MGRs of heterozygote strains. (A) Mean MGRs in 11 environments calculated for all strains as well as for domesticated and wild strains separately. Colors are used to distinguish between homozygous (orange) and heterozygous (violet) strains. (B) MGRs of individual strains in particular environments. Colors are indicative as already noted. (C) Components of variance (absolute values of σ2 estimates) attributable to the effect of environment (blue), genotype (gray), genotype–environment interaction (green), and error term (white). In this and other figures, SD is an abbreviation for minimal glucose medium. Other media include plain YPD at 30° (YPD) and its modifications as follows: 35° (Y35); ZnSO4 (Zn); galactose (Gal); NaCl (Na), salicylate (Sal); DMSO (DM); benomyl (Ben); glycerol (YPG); and 20° (Y20).

