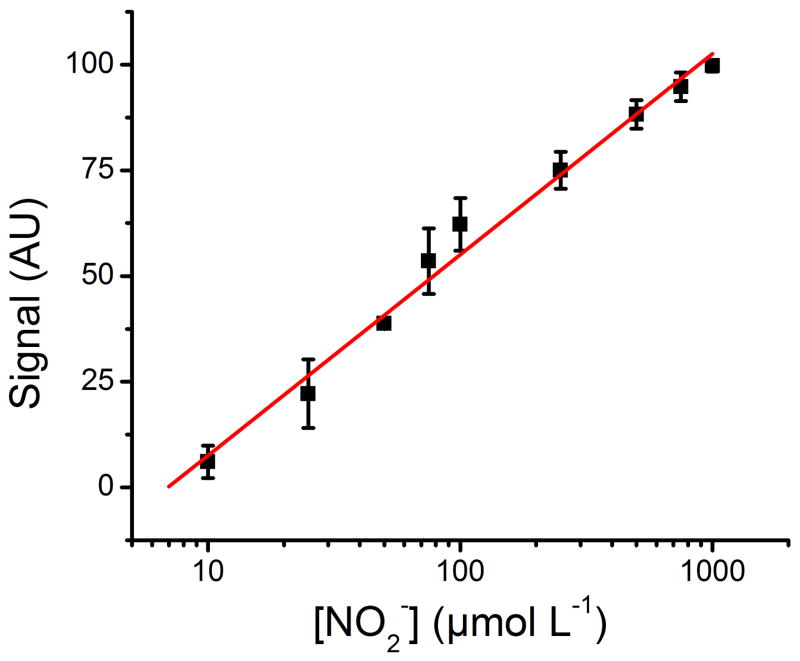
Figure 5.
Analytical calibration curve exhibiting logarithmic behavior from 10 – 1000 μmol L−1 nitrite. The standard solutions were prepared in artificial saliva and analyzed using the newly designed μPAD, a scanner, and the gray channel in Photoshop®. Signal was normalized against a selected blank location on the μPAD.

