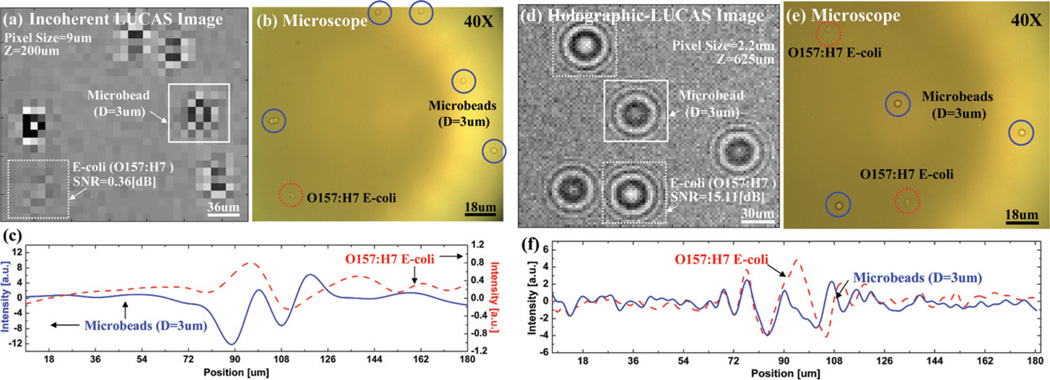
Fig. 2.
(a) Conventional incoherent LUCAS image for a mixture of polystyrene microbeads (D = 3 µm) and E. Coli samples imaged with a 9 µm pixel size sensor array. (b) For comparison purposes, a microscope image of the same field of view that is acquired with a 40× objective-lens is also shown. (c) The cross sectional intensity profile (taken from (a)) of the classical diffraction pattern of a microbead and an E. coli sample is illustrated. (d) Holographic-LUCAS image of the same heterogeneous solution now exhibits much better signature uniformity. Furthermore, the weak diffraction pattern of the E. coli samples is now significantly improved with over 40 times SNR improvement. (e) For comparison purposes, a microscope image of the same field of view that is acquired with a 40× objective-lens is also shown. (f) The cross sectional intensity profile (taken from (d)) of the holographic diffraction pattern of a microbead and an E. Coli sample is illustrated. Notice that the signal scale is different for the E. coli signature when compared to (c), which illustrates the improved performance of the Holographic-LUCAS platform for imaging weakly scattering phase objects such as small bacteria.

