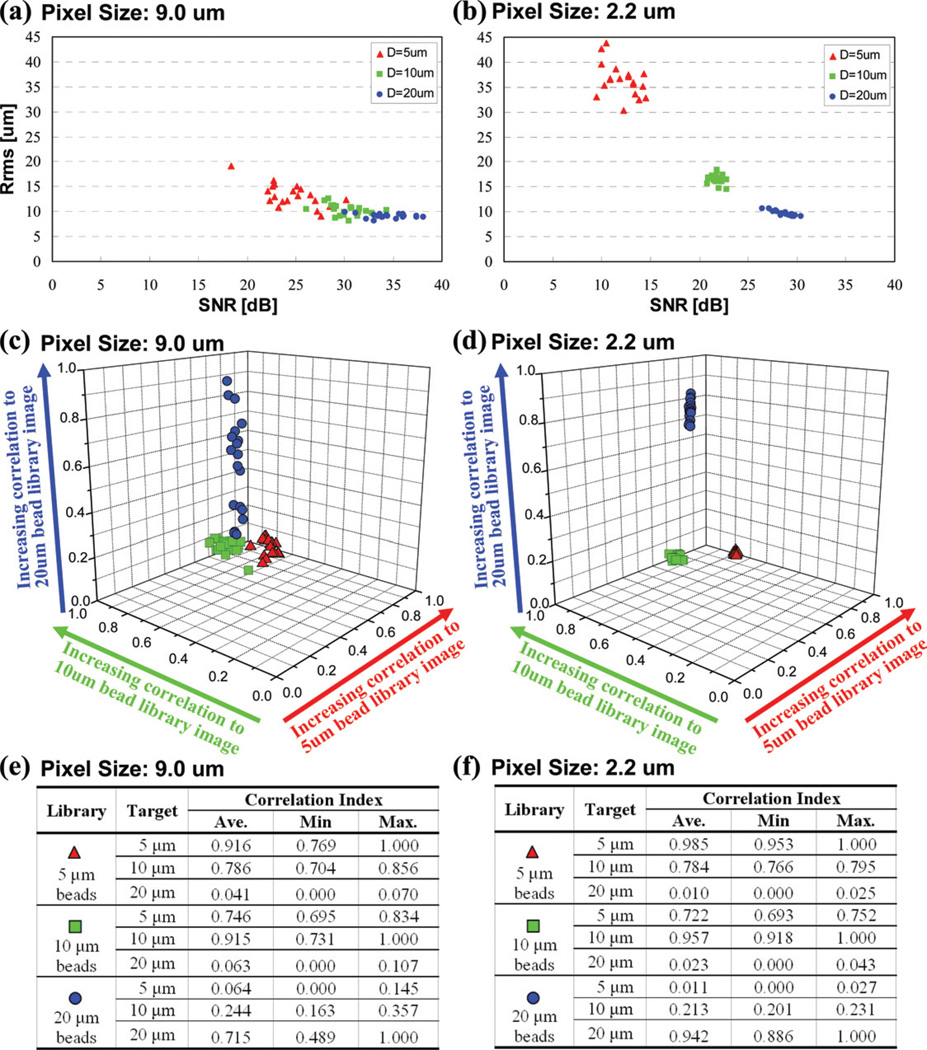
Fig. 4.
The effects of the pixel size of the sensor array on the statistical distribution of various image metrics calculated for three different microbead types are shown. (a) 9 µm pixel size performance: SNR and Rrms map for 20 samples from each micro-particle type is shown. (b) Same as (a) except for 2.2 µm pixel size sensor array. (c) 9 µm pixel size performance: The 3D correlation index map that is calculated using 20 samples from each micro-particle type is shown. (d) Same as (c) except for 2.2 µm pixel size sensor array. The tables in (e) and (f) briefly summarize the statistics of the correlation index results of (c) and (d), respectively. These results illustrate that the diffraction signature uniformity of each particle type is significantly improved using a high-resolution sensor array, yielding more reliable characterization decisions with distinct statistical groups for each one of the image metrics.

