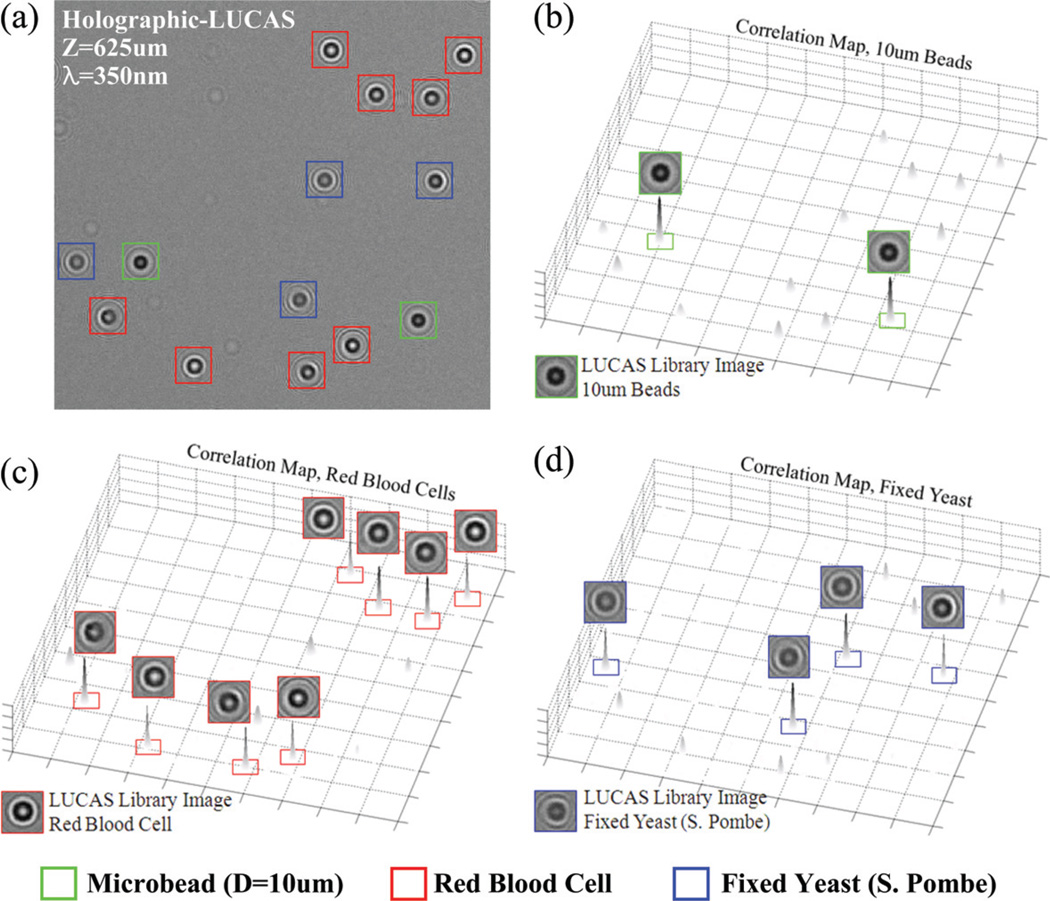
Fig. 6.
(a) Automatic characterization of a heterogeneous solution of RBCs, yeasts (S. Pombe) and 10 µm beads is illustrated using Holographic-LUCAS (λ = 350 nm). 2D correlation maps corresponding to each library image are also illustrated in (b–d), exhibiting sharp correlation peaks for the target cells/objects.

