
Figure 6. Significant Linear Relationships between Cocaine Anticipatory 50–55 kHz FM USVs and Self-Administered Cocaine, Cocaine-Induced 50–55 kHz FM USV, and Cocaine Anticipatory Locomotor Activity.
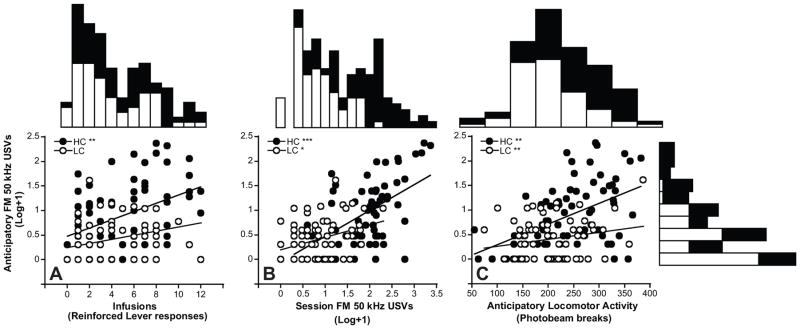
50–55 kHz FM USV data was log-transformed (log+1) for graphic depiction only. Pearson’s correlation tests were performed on raw data. Significant linear relationships were observed between Cocaine Anticipatory 50–55 kHz FM USVs and A) the number of self-administered cocaine infusions in the High USV Caller Group (p<0.01), B) the number of 50–55 kHz USVs elicited during Cocaine Self-Administration Sessions in both High and Low USV Caller groups (p <0.001 and 0.05, respectively), and C) the number of locomotor activity counts during Cocaine Anticipatory intervals for both High and Low USV Callers (p <0.01 for both; note log-transformed fit line for LC not reflecting significant linear relationship from raw data). Marginal histograms depict distribution of High and Low USV Callers across all measures.