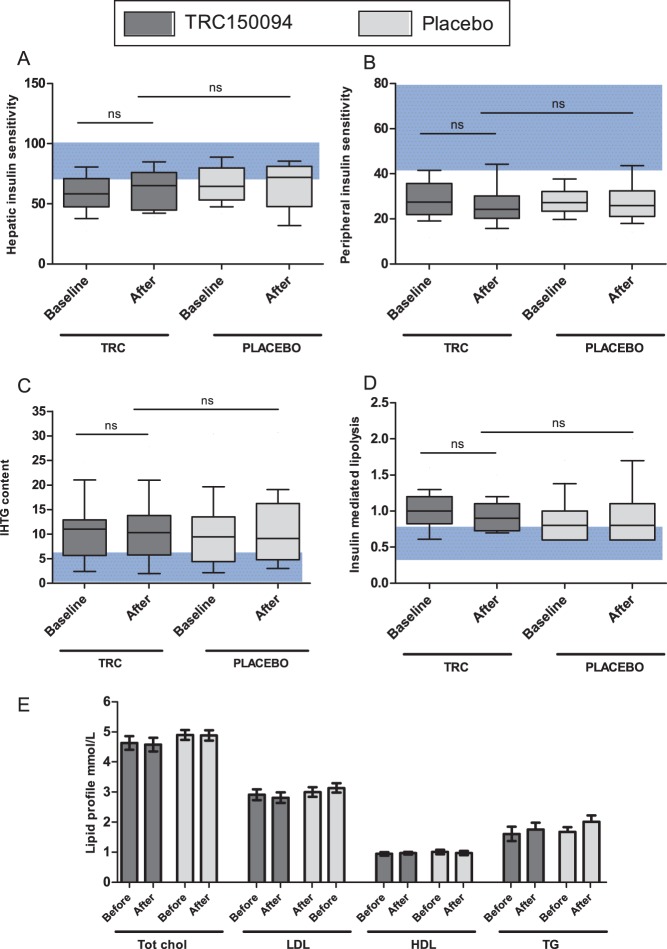
Figure 2. Efficacy data TRC150094 in males with increased cardiometabolic risk.
A–D; Box plots of hepatic insulin sensitivity (suppression of EGP %), peripheral insulin sensitivity (Rd umol*kg−1min−1), hepatic fat content (IHTG %) and insulin mediated suppression of lipolysis (suppression of lipolysis %) before after TRC administration. Blue background depicts reference values in healthy population, based on historical data [16]–[19]. E; Bar graph of lipid profile showing no improvement after TRC150094 administration.

