
Figure 2. Expression levels of the endo-NtFAD3 gene.
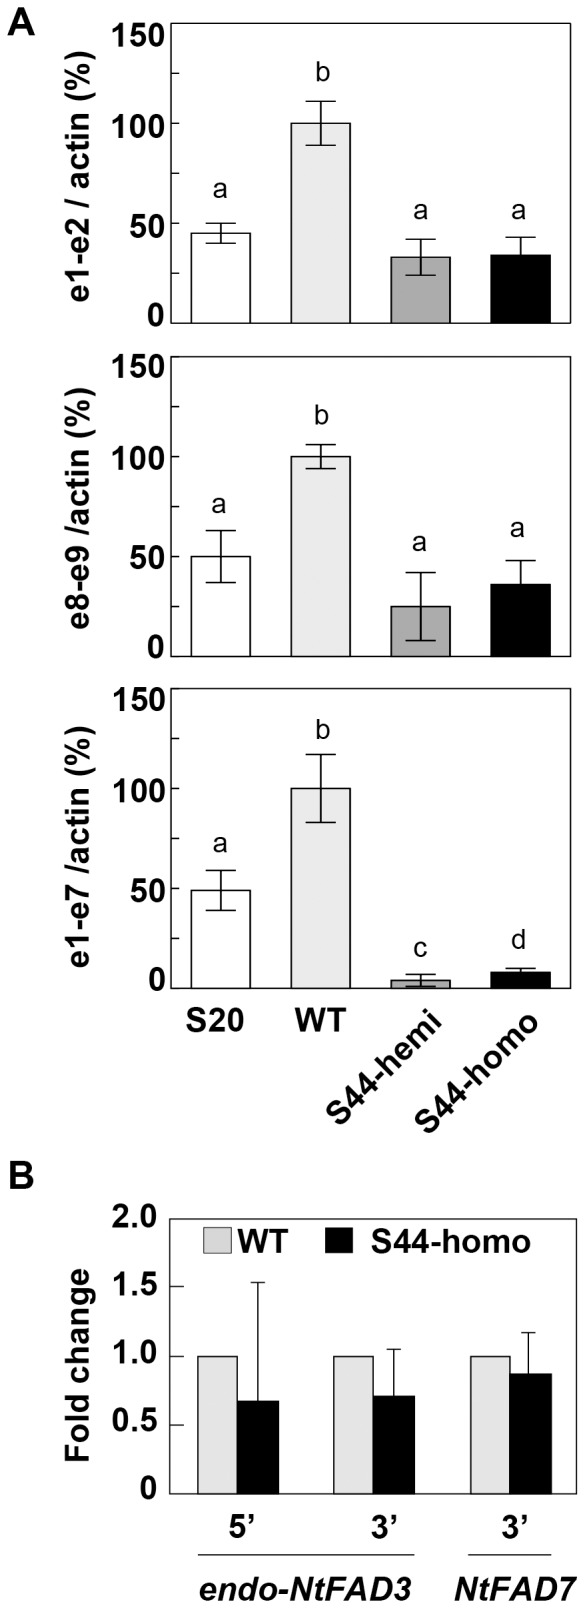
(A) The transcript levels of the endo-NtFAD3 gene in the total RNA fraction. Each endo-NtFAD3 transcript level was determined by qRT-PCR and normalized to the level of actin cDNA. The normalized value for the amount of endo-NtFAD3 mRNAs of the WT plants was considered to be 100%, and other normalized values in the S20, S44-hemi, and S44-homo plants were calculated as a percentage of that of the WT plants. e1-e2 and e8-e9 indicate the detection of endo-NtFAD3 transcripts that contain the proximal region (exon 1 to exon 2) and distal region (exon 8 to exon 9), respectively. e1-e7 indicates the detection of endo-NtFAD3 transcripts that contain a region from exon 1 to exon 7. The values are the mean ± SD (n = 3). (B) Pol II occupancy in the WT and S44 plants. ChIP-qPCR experiments were performed using an anti-Pol II antibody to detect the binding level at the indicated locus in the WT and the S44 plants. The mean of qPCR of the S44 sample is reported relative to the EF-1α gene control and is shown as a relative value of the corresponding WT level shown as 1.0. The graphical representation shows the fold change as the mean of the three different biological (and two different technical) replicates. The error bars represent SD. Different letters on the graph represent significantly different means (P<0.05).