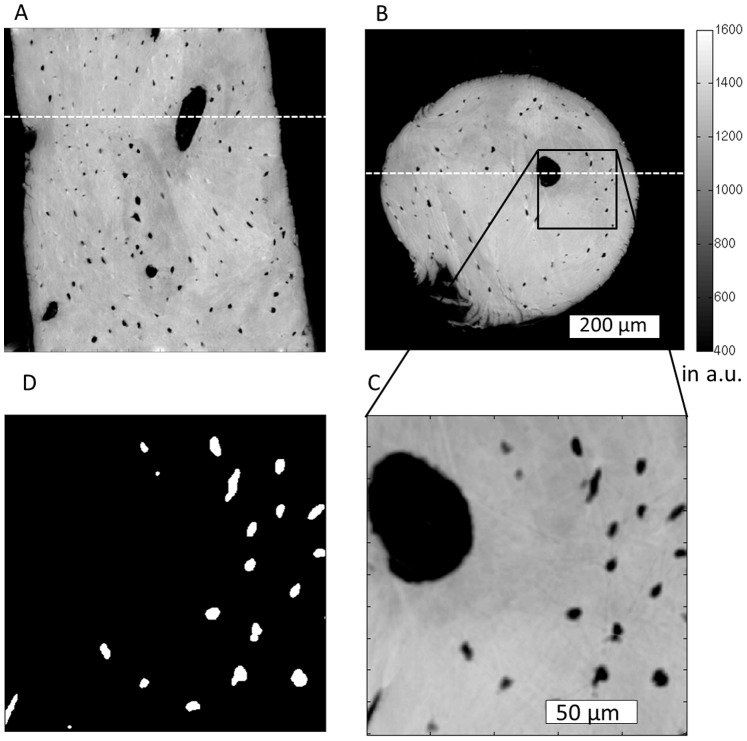
Figure 1. Slides of a reconstructed volume corresponding to a control jaw specimen are shown in A (x-y-plane) and B (x-z-plane).
The white dashed lines in A and B indicate where A is located in B and vice versa. C shows a minimum intensity projection, the projection range is 30 pixels (10.5 µm). D shows the lacunae mask corresponding to C, also in the form of an intensity projection (z-range = 30 pixels). Color bar in mass density of a.u.

