
Figure 3. Histogram of the mass-per-length distribution in MDa/nm for a Spiroplasma cell population.
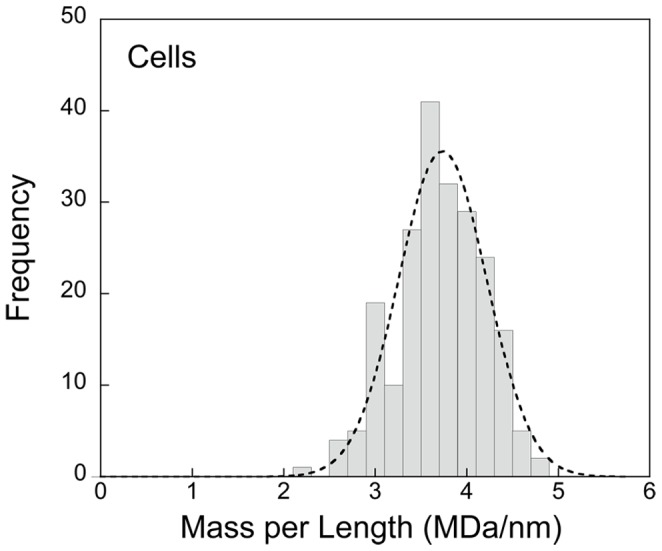
The Gaussian (r2 = 0.97) fit superimposed on the histogram implies a normal distribution. The average mass is 3.74±0.68 (SD) MDa/nm. The mass of an average cell is 22.2 GDa.