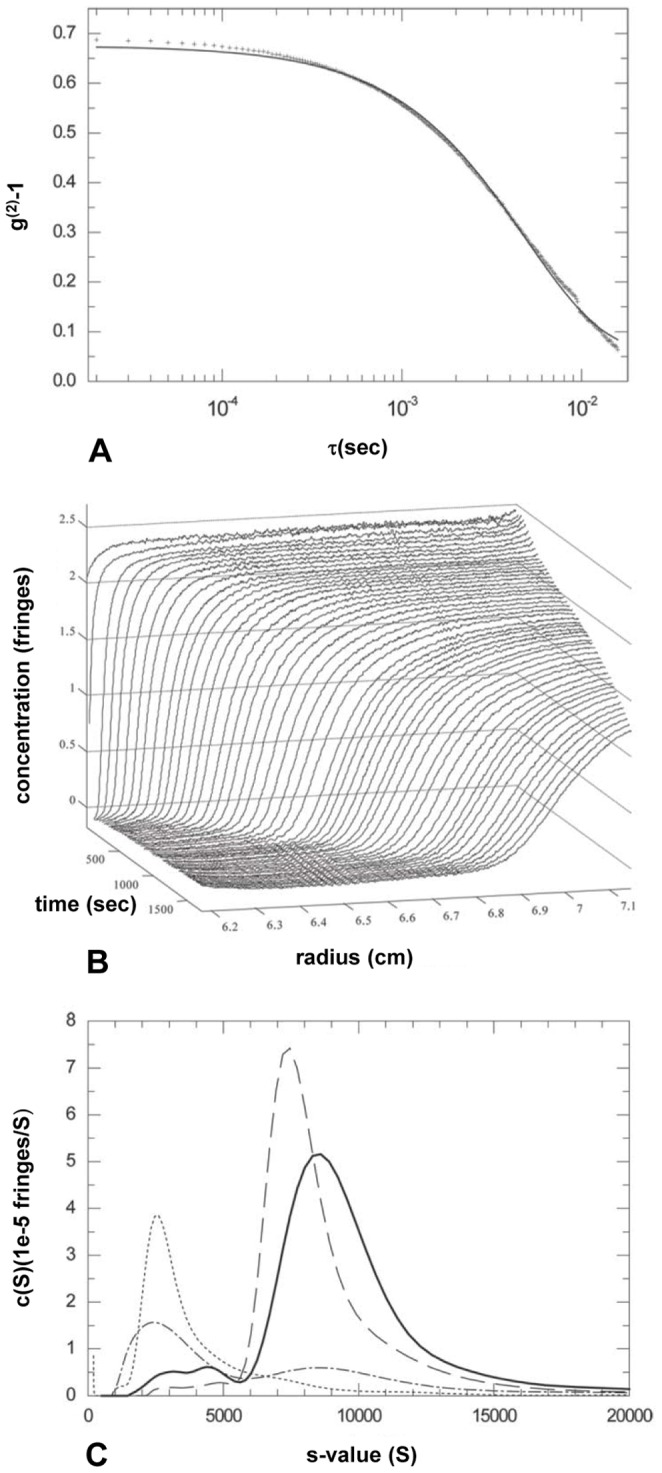
Figure 4. Hydrodynamic studies of a Spiroplasma cell population.

[A] Dynamic light scattering of live Spiroplasma cells in isotonic PBS. Shown is the autocorrelation g(2)-1 function acquired at 90° (crosses) overlaid with the best-fit single species fit (solid line). The data estimate an average diffusion constant of 6.1×10⁻⁹ cm2/sec. [B] Evolution of concentration profiles across the Spiroplasma sample in PBS at various times after the start of centrifugation at 3,000 rpm. [C] Sedimentation coefficient distributions calculated by least-squares modeling of the concentration distributions in [B] by superposition of Lamm equation solutions of non-diffusing species, ls-g*(s). Shown are the distributions obtained at Spiroplasma concentrations of 0.015 mg/ml (dash-dotted line), 0.15 mg/ml (solid line), 1.5 mg/ml (dashed line) and buffer (dotted line).
