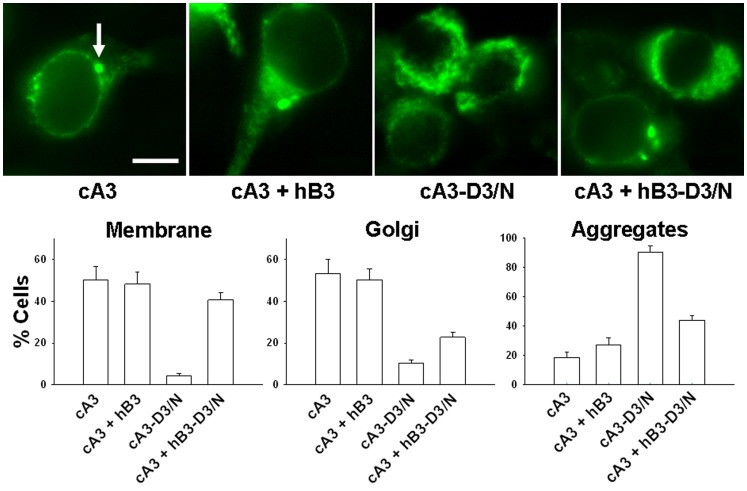
Figure 4. Cellular localization of YFP-tagged cA3 constructs.
Upper panels: Micrographs illustrating expression of cA3, cA3-D3/N, cA3+ hB3, and cA3+ hB3-D3/N; the arrow indicates a Golgi-like organelle. Intracellular aggregates are seen in all but the cA3-Y cells. Lower panels: averaged expression characteristics constructed from counts of >800 cells. The cA3 and cA3+hB3 expression patterns have a small but significant increase in intracellular aggregates (p = 0.02 on unpaired t-test). Clear, significant differences are seen with expression of mutant D3/N subunits although see text for the interpretation of the cA3+ hB3-D3/N mutant subunit. Scale bar 10 µm.

