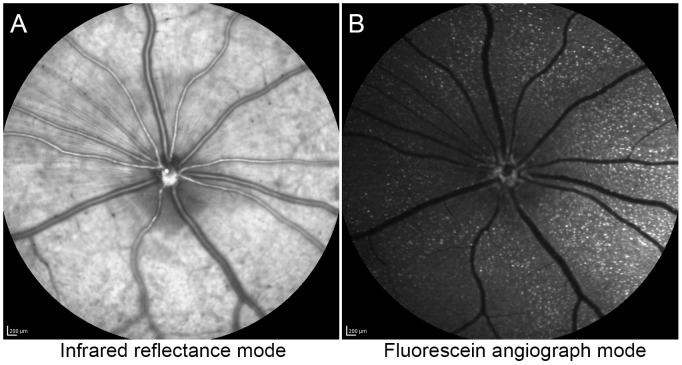
Figure 1. In vivo confocal scanning laser ophthalmoscopic imaging of single retinal ganglion cell (RGC) apoptosis.
(A) Infrared reflection fundus image at 25 hours post-probe injection from a rat eye pretreated with 25 mM NMDA and followed 24 hrs later by injection of 0.387 nmol TcapQ488. The image was focused on the Nerve Fiber Layer using a 55°FOV lens. (B) Fluorescein angiograph (FA) mode fundus image from the same eye at the same time point and focal plane showing distinct fluorescent signals from probe activation. Both images were recorded as an average of 100 aligned frames to obtain a single low-noise, high contrast image. Scale bar in both images, 200 µm.

