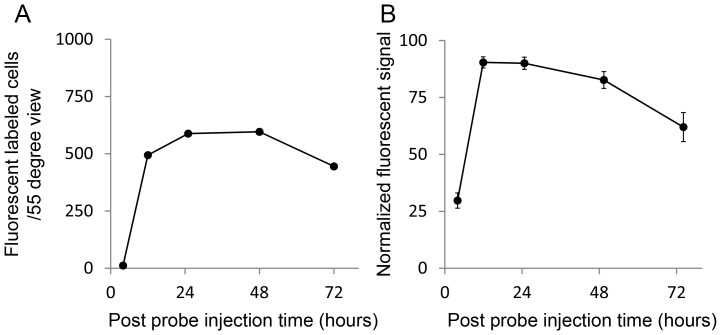
Figure 4. Quantitative plot of probe activation from live images.
(A) Plot of probe activation from images in Figure 3 B–F. (B) Probe activation normalized to maximum counts from an individual eye at each time point was averaged across all probe dose/NMDA concentration combinations. Probe activation increased significantly in the first 12 hours and generally decreased slowly thereafter. Data represent mean ± SEM.

