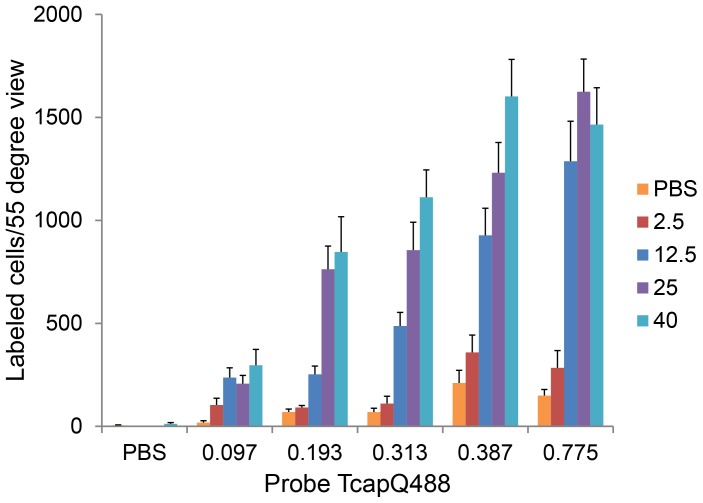
Figure 7. Probe activation in vivo as a function of both NMDA concentration and probe dose.
Retinal ganglion cell apoptosis was induced in rats by intravitreal injection of NMDA at various concentrations (0 (PBS only), 2.5, 12.5, 25 and 40 mM), followed by intravitreal injection of TcapQ488 (at 0 (PBS only), 0.097, 0.193, 0.313, 0.387 and 0.775 nmol) for a total of 27 NMDA-probe-dose combinations. Data reflect imaging at 12 hours post-probe injection. Probe signal increased as both NMDA concentration and probe dose increased. The plateau in TcapQ488 activation above 0.313 nmol indicates saturation of the dynamic range of probe dosing. n≥3 (5 to 8 eyes) at each combination. Data represent mean ± SEM.

