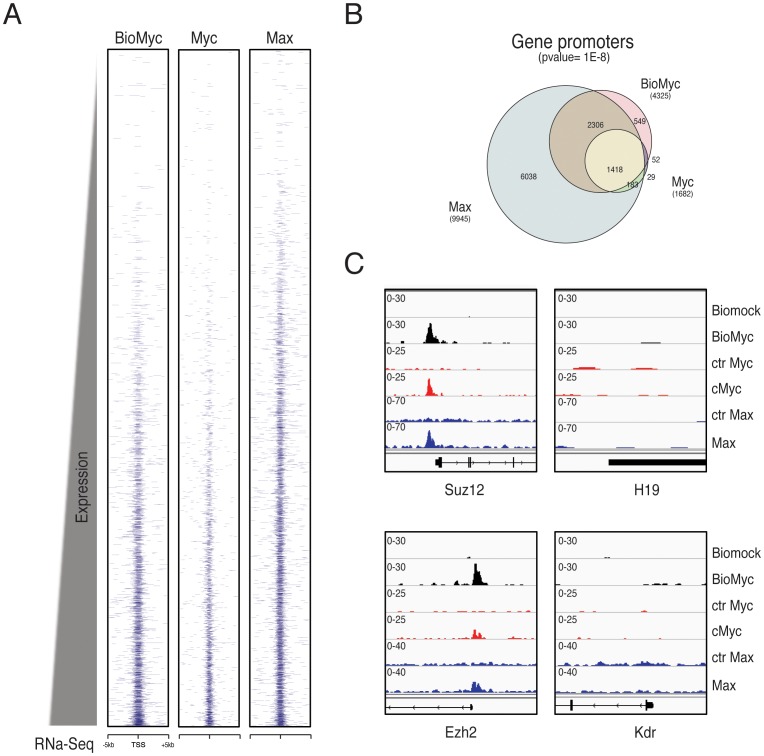
Figure 2. Comparison of Biotag-Myc versus anti-Myc antibody Chip-Seq.
(A) Heatmap representation of ChIP-Seq binding for BioMyc, Myc, and Max around transcriptional start sites (TSSs) ±5 kb for all genes rank ordered from the lowest to the most highly expressed according to thee mRNA expression levels obtained from RNA-Seq analysis. (B) Venn diagram showing the exact number of promoters bound in the indicated ChIP-Seq analyses. Bio-Myc ChIP-Seq found many more genes bound on TSSs in comparison with the endogenous Myc ChIP-Seq (4325 TSS vs. 1682 TSSs, respectively), and Bio-Myc ChIP-Seq shows more overlapping genes with Max ChIP-Seq (2306 vs. 1418, respectively). (C) Genomic occupancy profiles of the indicated Chip-Seq show a well-defined peak of enrichment on the E-Box at the Suz12 promoter (−570 bp from TSS) and the Ezh2 TSS, while there is no binding at the promoters of the negative control genes (H19 and Kdr).

