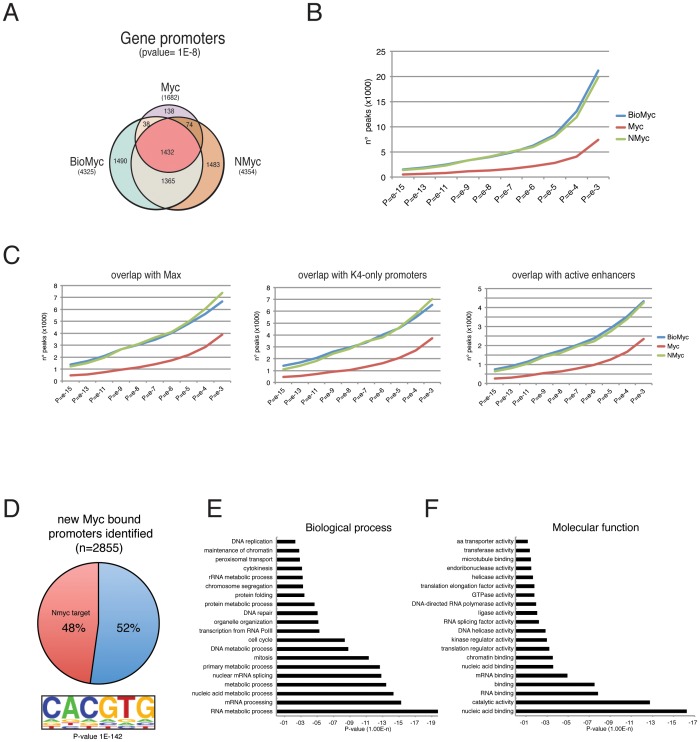
Figure 4. Biotag-Myc identifies a large number of Myc binding sites in ESCs.
(A) Venn diagram showing the number of gene promoters bound in the indicated ChIP-Seq analyses and their overlap. (B) Bio-Myc ChIP-Seq was able to identify many more bound regions in comparison with Myc ChIP-Seq as shown by the number of peaks found at each p-value indicated. (C) The genomic colocalization of Bio-Myc peaks with Max, H3K4me3-only promoters, and active enhancers at different p-values. Bio-Myc ChIP-Seq always reveals a major number of peaks overlapping with the indicated genomic features and shows a similar distribution to the NMyc dataset. (D) About 50% of the newly identified Myc-bound promoters show overlap with NMyc targets and an enrichment in the motif sequence corresponding to the perfect Myc E-Box (p-value 1E-142). (E–F) Gene ontology analysis reveals that the newly identified Myc target genes are enriched for genes associated with the cell cycle and cell metabolism as well as genes with molecular functions involved in the metabolism of nucleic acid and chromatin structure.

