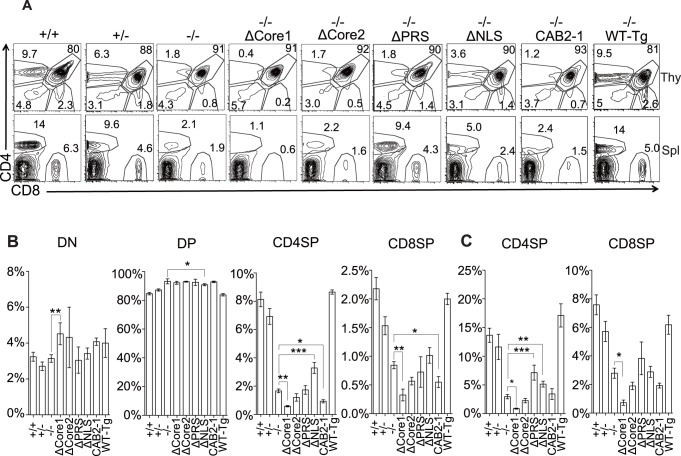
Figure 2. Expression of the Themis mutants failed to restore positive selection in Themis−/− mice.
(A) CD4 and CD8 expression profiles of thymocytes or splenocytes from Themis mutant mice. Numbers in plots show the frequency of cells in the indicated area. Proportion (%) of indicated subsets of (B) thymocytes and (C) splenocytes (mean ± SEM). (A-C) Data are representative of more than three independent experiments. Only significant differences against −/− mice are noted in the graphs. *p<0.05, **p<0.01, ***p<0.001.

