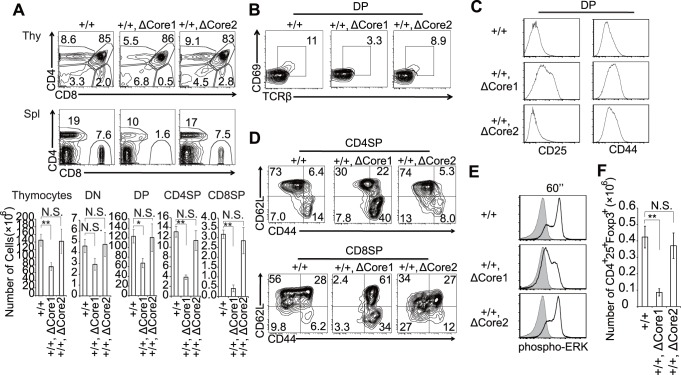
Figure 5. The CABIT1 and CABIT2 in Themis have different functions.
(A) CD4 and CD8 profiles of thymocytes and splenocytes of Themis+/+, Themis+/+ ΔCore1, and Themis+/+ ΔCore2 mice. Numbers in plots show the frequency of cells in the indicated area. Bar graphs show absolute number of total thymocytes and thymocyte subsets from Themis+/+, Themis+/+ ΔCore1, and Themis+/+ ΔCore2 mice (mean ± SEM). Data are representative of four independent experiments. (B) Proportion of post-selected CD69+ TCRhi cells in CD4+CD8+ (DP) thymocytes. Data are representative of four independent experiments. (C) Surface expression of CD25 and CD44 on gated DP thymocytes. Data are representative of four independent experiments. (D) CD44 and CD62L profile of splenic CD4SP and CD8SP cells. Data are representative of four independent experiments. (E) Representative histogram overlays of phosphorylation of ERK. DP thymocytes were stimulated with anti-CD3 plus anti-CD4 Abs for 1min, then intracellular staining of phosphorylated-ERK antibody was performed (solid line). The shaded line is without stimulation. Data are representative of three independent experiments. (F) Absolute number of thymic CD4+25+Foxp3+ Treg cells (mean ± SEM). Data are representative of four independent experiments. Significant differences are noted in the graphs. *p<0.05, **p<0.01. N.S. = not significant.

